Fig. 8
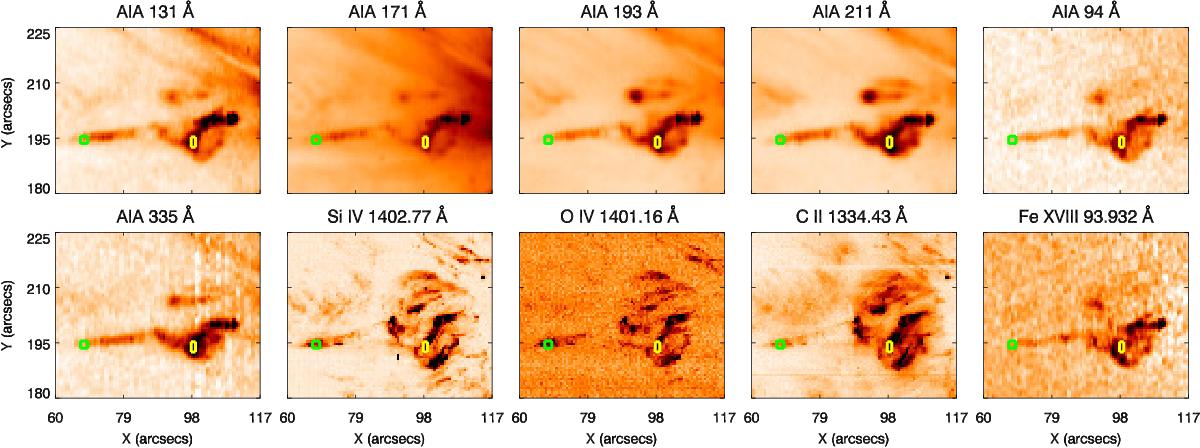
AIA and IRIS images indicating regions for DEM determination. The time-averaged (reverse colour) AIA and Fe XVIII images together with rebinned, calibrated Si IV, O IV, C II raster images obtained for jet 4. The averaged intensities in the green and yellow oveplotted boxes were used to calculate DEMs for the spire (08:20:29–08:21:00 UT) and footpoint (08:28:03–08:28:18 UT) structures respectively. The times indicated in parentheses are the start times for the first and last slit exposures corresponding to the boxed regions.
Current usage metrics show cumulative count of Article Views (full-text article views including HTML views, PDF and ePub downloads, according to the available data) and Abstracts Views on Vision4Press platform.
Data correspond to usage on the plateform after 2015. The current usage metrics is available 48-96 hours after online publication and is updated daily on week days.
Initial download of the metrics may take a while.