Fig. 7
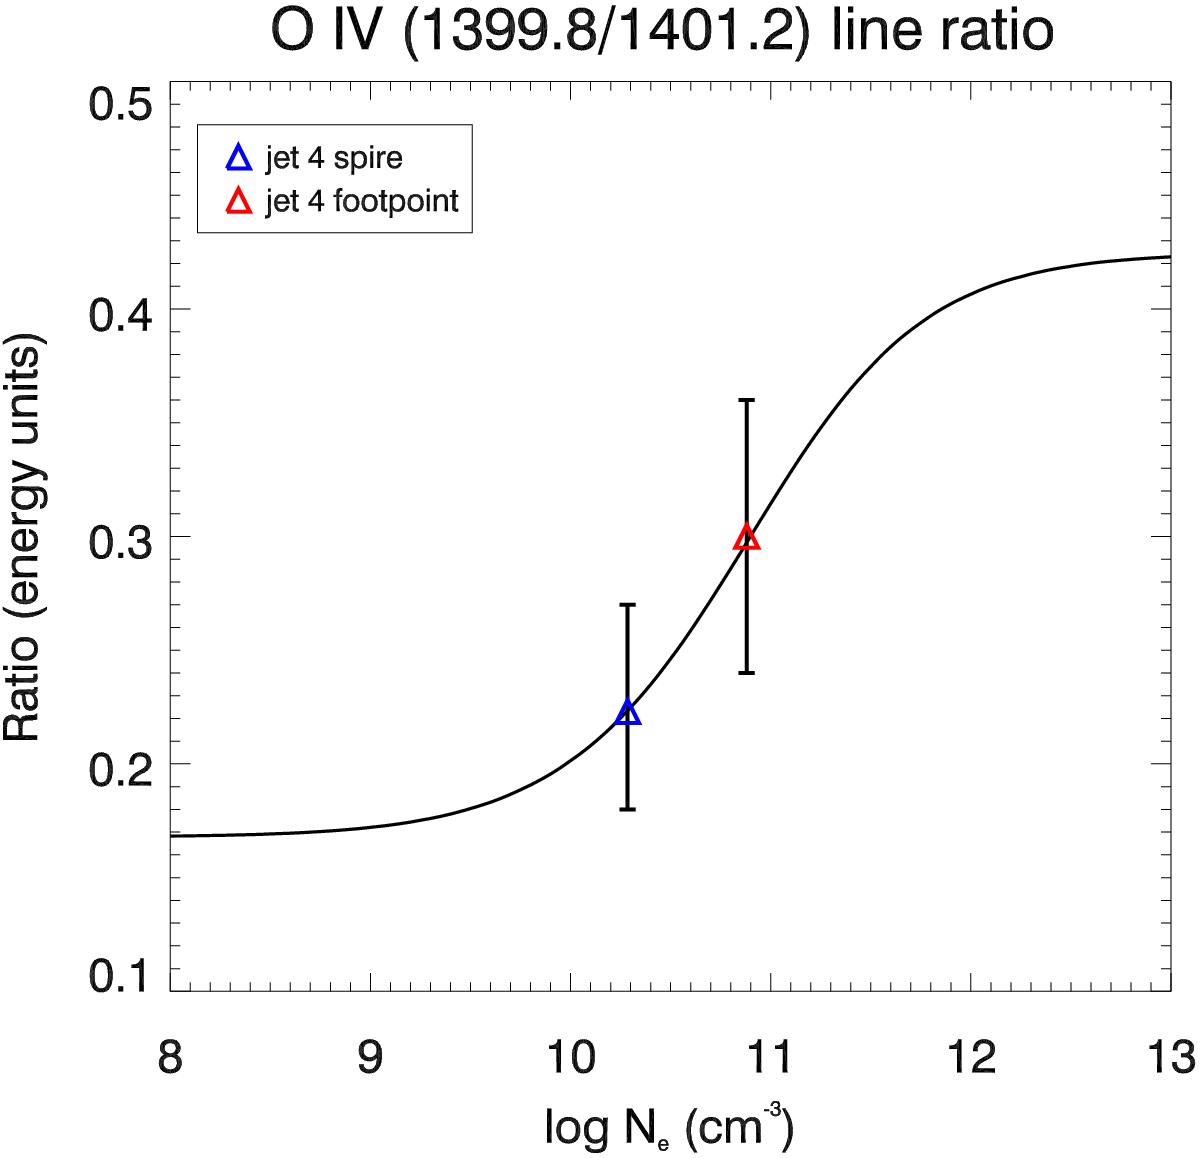
O IV density measurements. The theoretical intensity ratio for the O IV (λ1399.8/λ1401.2 Å) line pair as a function of electron density. The blue and red triangles represent observed densities for the spire (Ne = 2.0×1010 cm-3) and footpoint (Ne = 7.6×1010 cm-3) of the jet 4. The black vertical lines represent error bars calculated by considering 20% uncertainty.
Current usage metrics show cumulative count of Article Views (full-text article views including HTML views, PDF and ePub downloads, according to the available data) and Abstracts Views on Vision4Press platform.
Data correspond to usage on the plateform after 2015. The current usage metrics is available 48-96 hours after online publication and is updated daily on week days.
Initial download of the metrics may take a while.