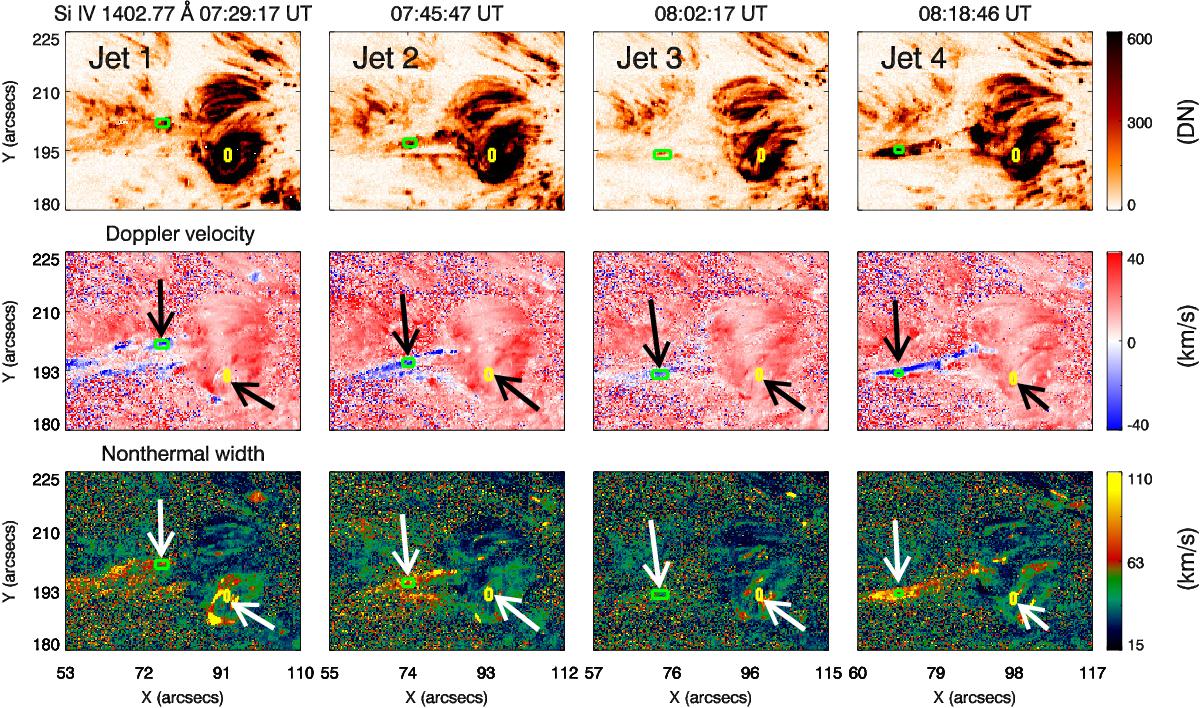
Fig. 6

IRIS spectrograph images of the recurrent jet. The Si IV intensity maps (top panel; reverse colour), Doppler velocity maps (middle panel) and nonthermal velocity maps (bottom panel) for four rasters. The times indicate the start time for each raster. The oveplotted green and yellow boxes show the spire and footpoint regions respectively. These regions were used for the calculation of Doppler (shown by black arrows) and nonthermal (shown by white arrows) velocities.
Current usage metrics show cumulative count of Article Views (full-text article views including HTML views, PDF and ePub downloads, according to the available data) and Abstracts Views on Vision4Press platform.
Data correspond to usage on the plateform after 2015. The current usage metrics is available 48-96 hours after online publication and is updated daily on week days.
Initial download of the metrics may take a while.


