Fig. 4
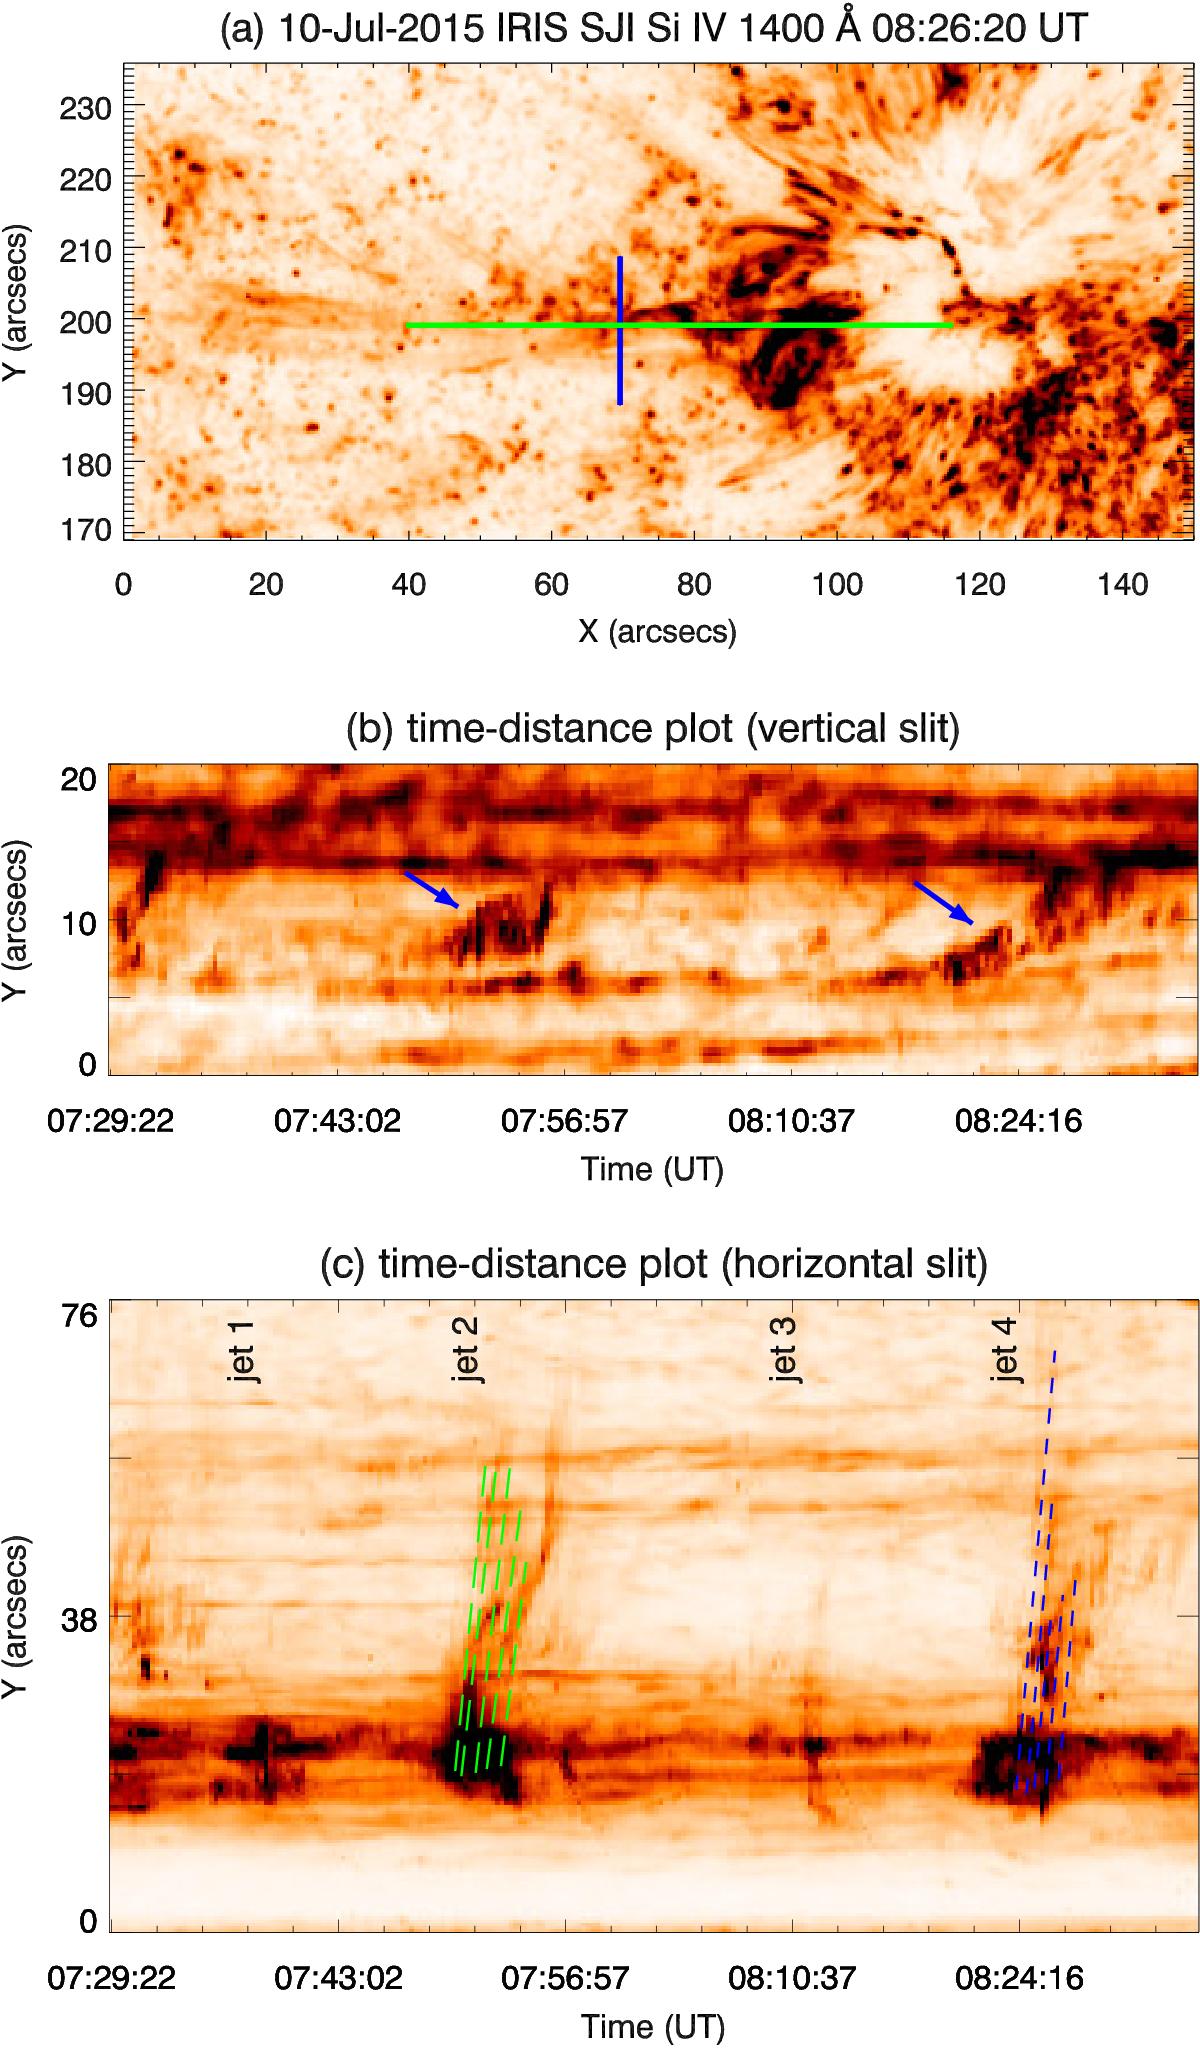
SJI plane-of-sky velocities. Panel a: the SJI Si IV 1400 Å image (reverse colour) at 08:26:20 UT. The overplotted horizontal (green) and vertical (blue) lines represent two artificial slit positions where we obtained time-distance plots. Panel b: the time-distance plot for the vertical slit position (reverse colour). The features shown by blue arrows represent an untwisting motion of the jet spire structures. Panel c: the time-distance plot obtained from the horizontal slit position (reverse colour). The long dashed green lines are overplotted on threads of the spire of jet 2 and dashed blue lines are overplotted on threads of the spire of jet 4. These lines were used to calculate the plane-of-sky velocities.
Current usage metrics show cumulative count of Article Views (full-text article views including HTML views, PDF and ePub downloads, according to the available data) and Abstracts Views on Vision4Press platform.
Data correspond to usage on the plateform after 2015. The current usage metrics is available 48-96 hours after online publication and is updated daily on week days.
Initial download of the metrics may take a while.