Fig. 2
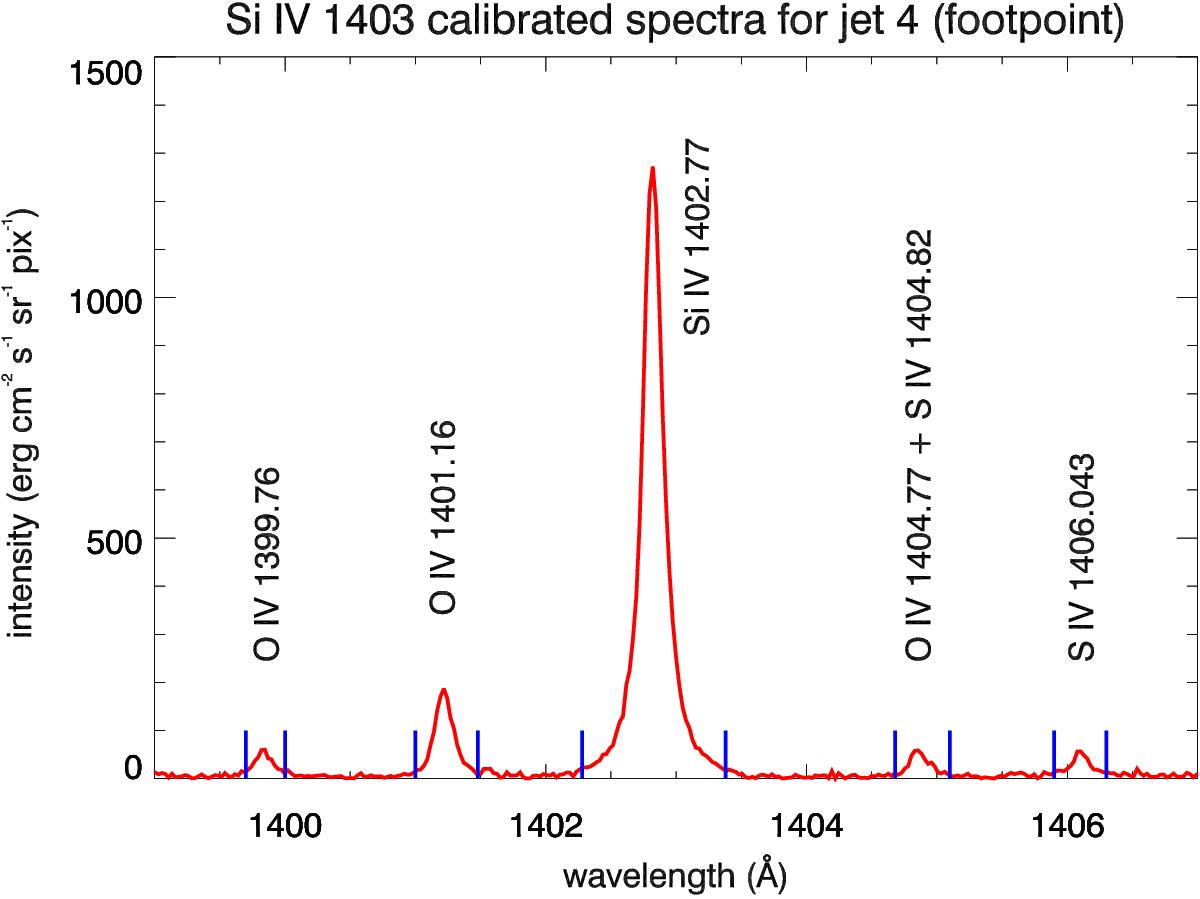
IRIS spectra for the footpoint region of jet. The calibrated spectra (in erg cm-2 s-1 sr-1 pix-1 units) obtained for the Si IV 1403 Å window for the footpoint region of the jet observed in the fourth raster scan (shown as a small yellow box in Fig. 8). The blue vertical lines show the wavelength ranges over which we obtained the total counts for each line.
Current usage metrics show cumulative count of Article Views (full-text article views including HTML views, PDF and ePub downloads, according to the available data) and Abstracts Views on Vision4Press platform.
Data correspond to usage on the plateform after 2015. The current usage metrics is available 48-96 hours after online publication and is updated daily on week days.
Initial download of the metrics may take a while.