Free Access
Fig. A.4
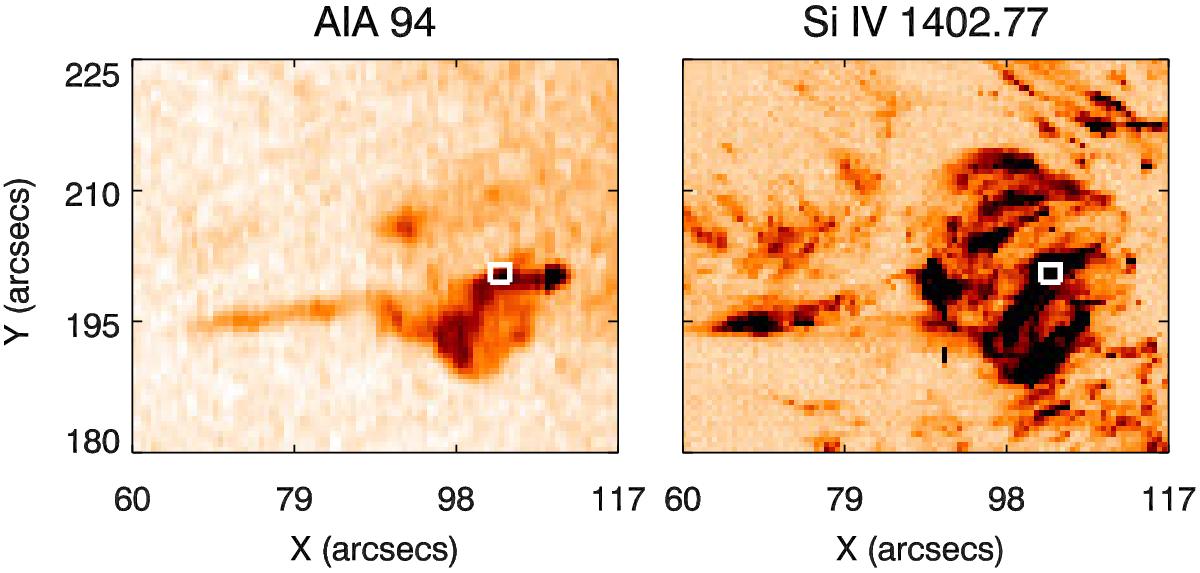
DEM input for another footpoint region. The time-averaged (reverse colours) image of the AIA 94 Å channel (left panel) and rebinned calibrated Si IV raster image (right panel). The white overplotted boxes represent a region in the jet-footpoint where we perfomed the DEM analysis.
Current usage metrics show cumulative count of Article Views (full-text article views including HTML views, PDF and ePub downloads, according to the available data) and Abstracts Views on Vision4Press platform.
Data correspond to usage on the plateform after 2015. The current usage metrics is available 48-96 hours after online publication and is updated daily on week days.
Initial download of the metrics may take a while.