Free Access
Fig. A.2
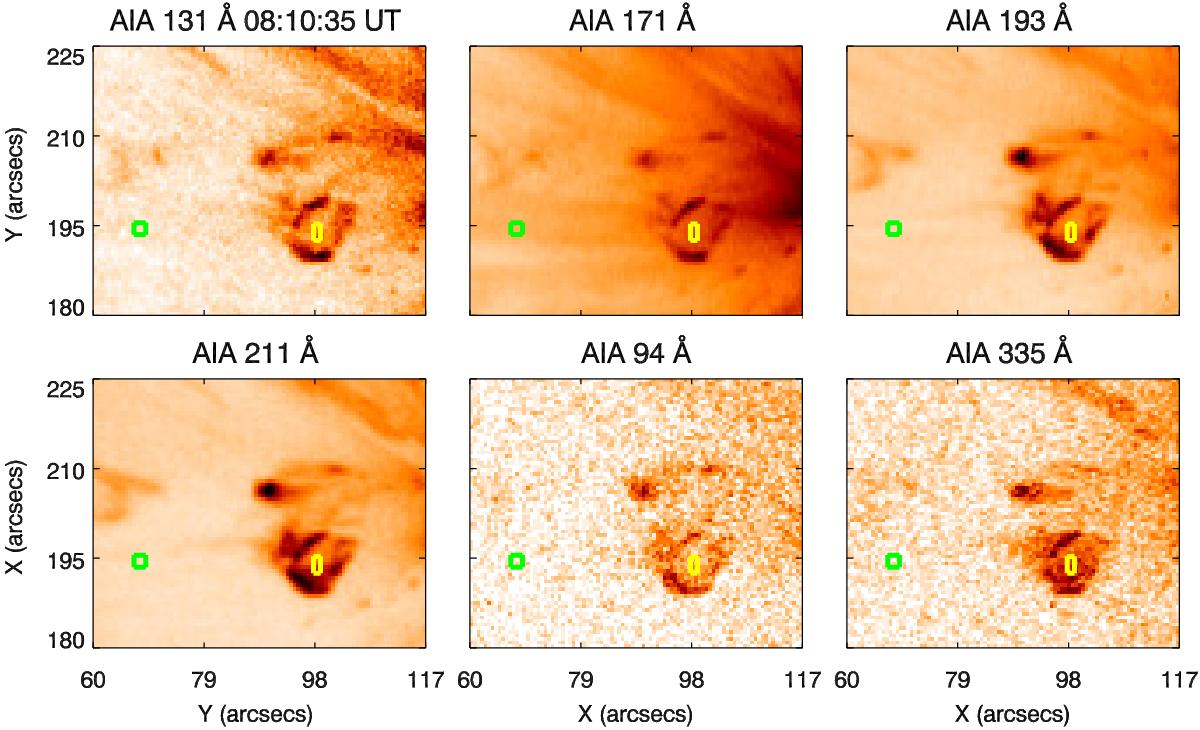
AIA images during the pre-jet phase. AIA (reverse colours) images in six coronal channels at 08:10:35 UT represent pre-jet phase of jet 4. The green and yellow boxes indicate the region of the spire and the footpoint respectively (same as shown in Fig. 8).
Current usage metrics show cumulative count of Article Views (full-text article views including HTML views, PDF and ePub downloads, according to the available data) and Abstracts Views on Vision4Press platform.
Data correspond to usage on the plateform after 2015. The current usage metrics is available 48-96 hours after online publication and is updated daily on week days.
Initial download of the metrics may take a while.