Free Access
Fig. 10
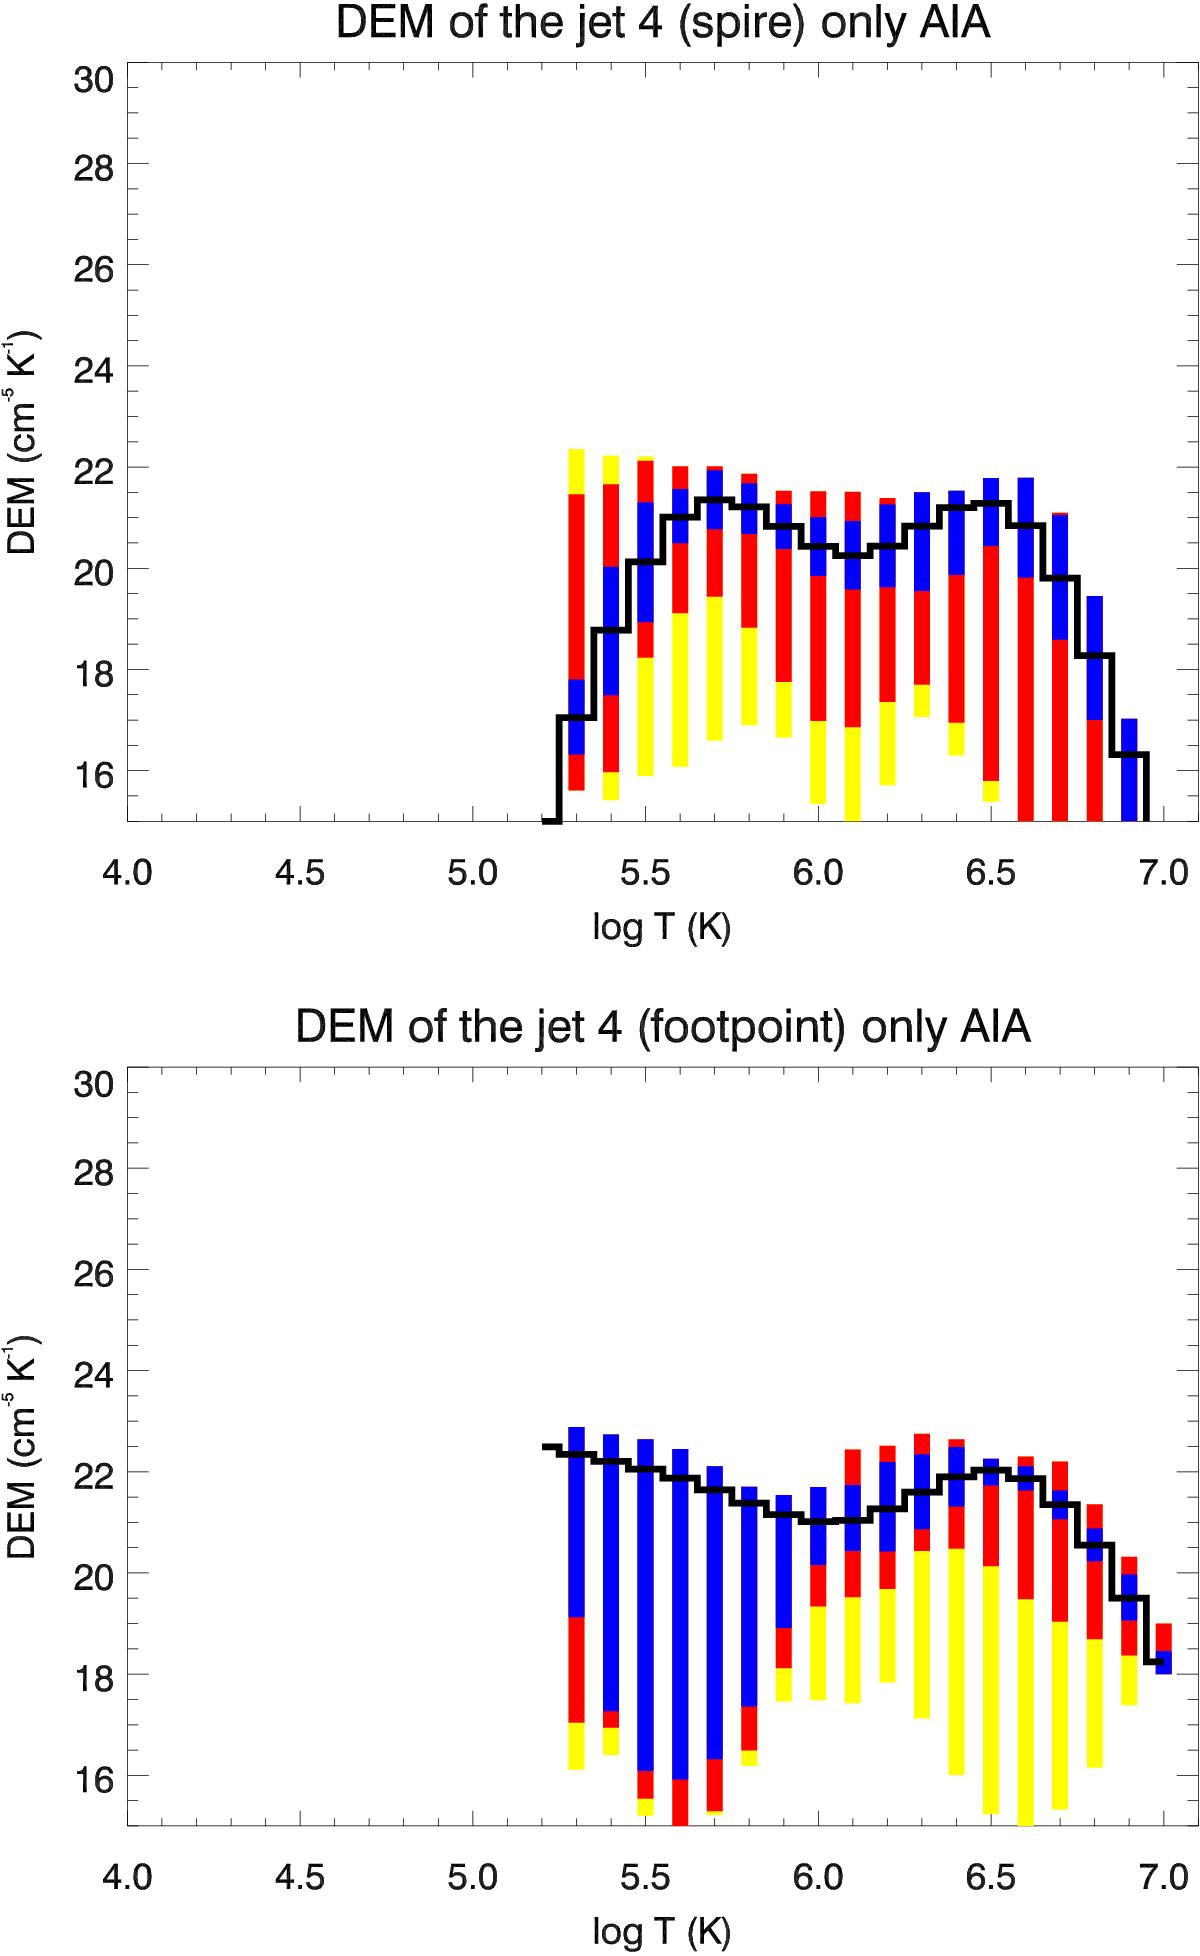
DEM results for footpoint. The DEM curves for the spire (top panel) and footpoint (bottom panel) region of the jet 4 using only AIA images shown in Fig. 8. The overplotted colour bars show 50% (blue), 80% (red) and 95% (yellow) of the 300 MC solutions relative to the best-fit DEM.
This figure is made of several images, please see below:
Current usage metrics show cumulative count of Article Views (full-text article views including HTML views, PDF and ePub downloads, according to the available data) and Abstracts Views on Vision4Press platform.
Data correspond to usage on the plateform after 2015. The current usage metrics is available 48-96 hours after online publication and is updated daily on week days.
Initial download of the metrics may take a while.