Fig. 8
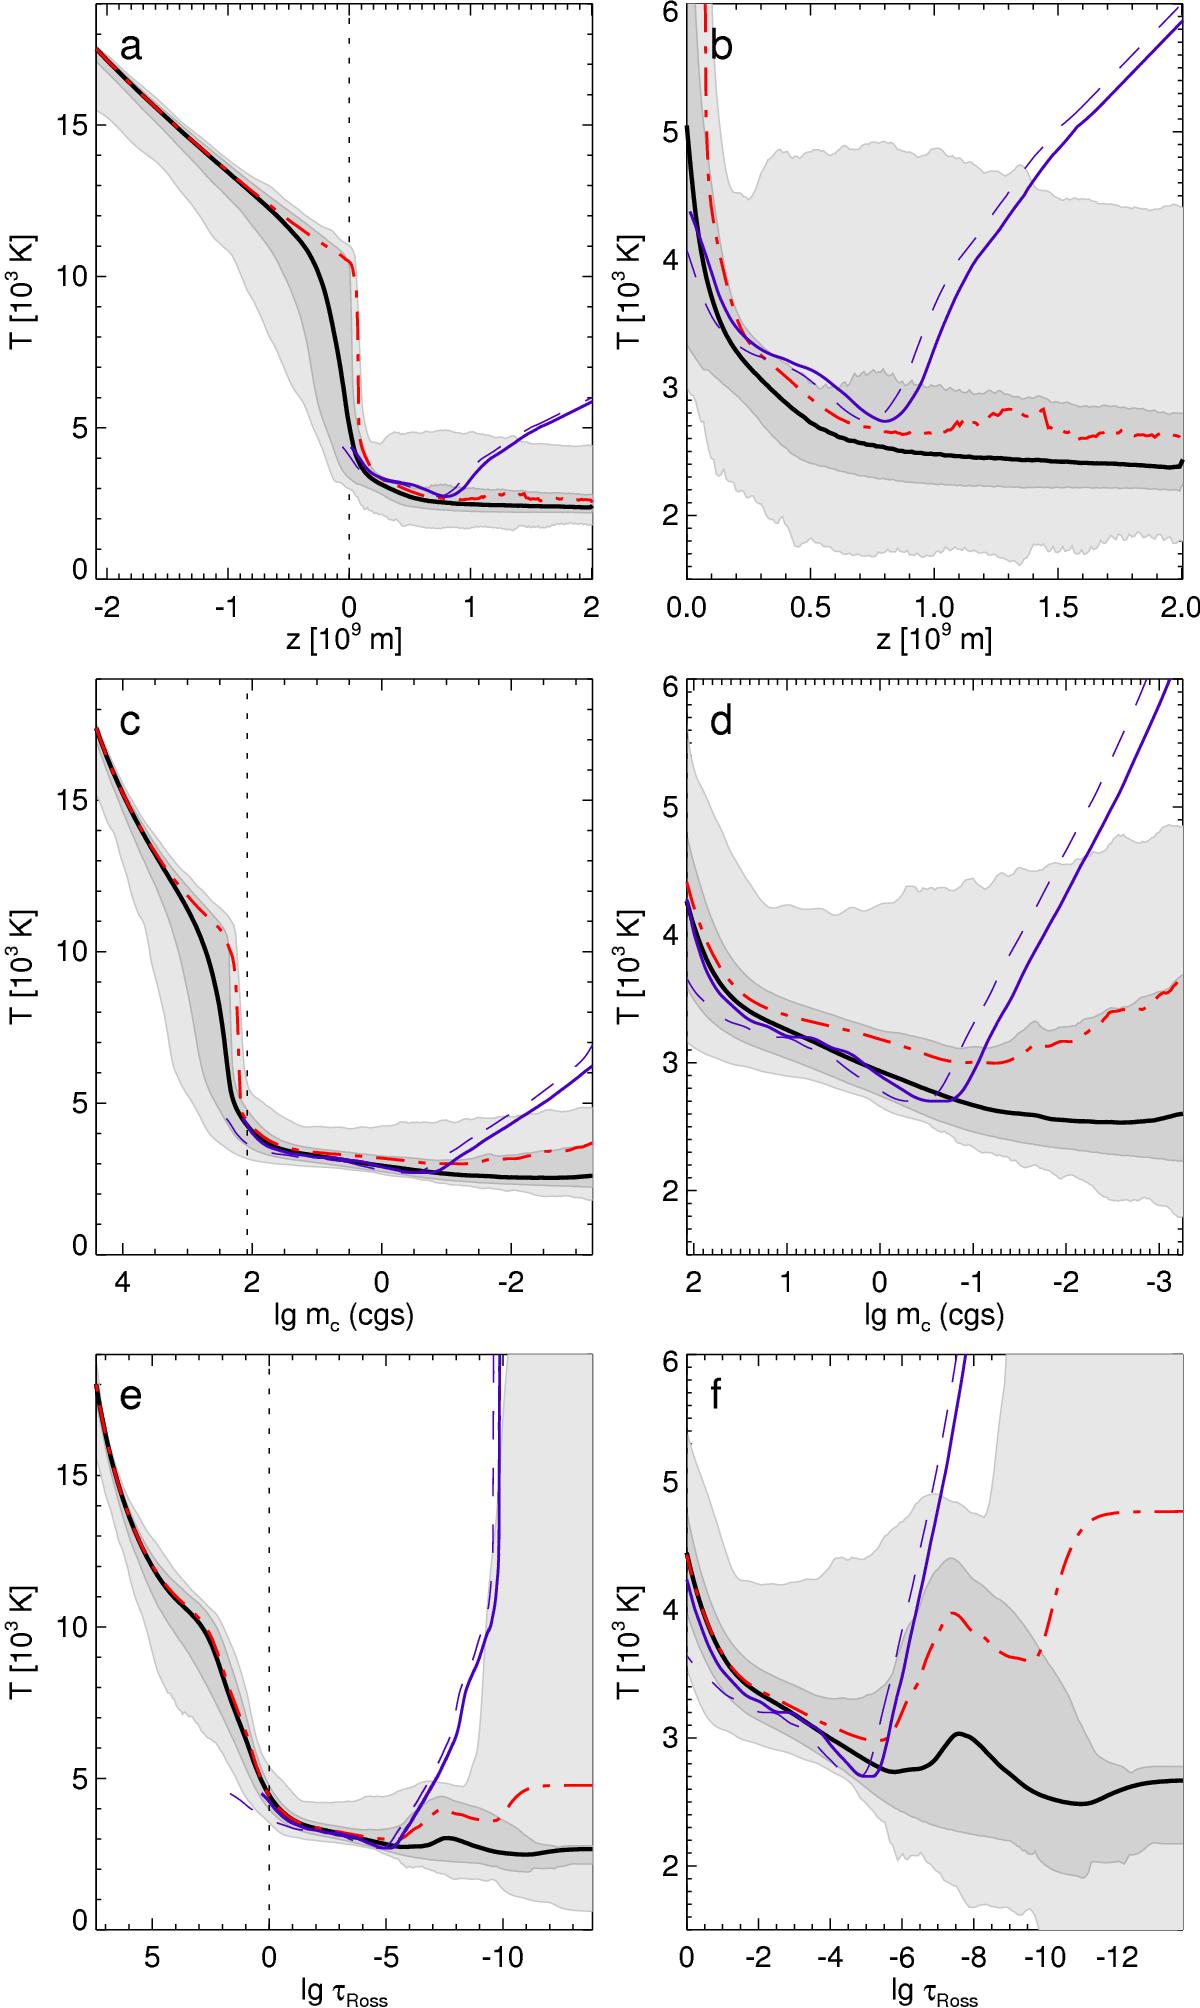
Average stratification of the gas temperature on the a), b) geometric height scale, c), d) column mass scale, and e), f) optical depth scale. The right column repeats the data in the left column, but only for the atmospheric layers (i.e. those located to the right of the vertical dashed line in the panels on the left). The arithmetic temperature averages are shown as solid black lines, whereas the corresponding average emissivity temperatures as defined in Eq. (1) are represented by the red dot-dashed lines. The light grey shaded areas mark the whole range of values between the minimum and maximum at each height or column mass or optical depth, whereas the dark grey areas represent the corresponding values between the 5th and 95th percentiles, i.e. the majority of all values except for the most extreme ones. We note that these are distributions for the selected model snapshot only. For comparison, the α Tau model atmosphere by McMurry (1999) is plotted in all panels as blue dashed lines. Applying small offsets of Δz = 7 × 10⁷ m and Δlgmc = − 0.25, respectively, produces a better match with our simulation and the shifted McMurry model (thick blue line). The optical depth scale for the McMurry is derived from matching the column mass scale to the optical depth scale in the 3D model.
Current usage metrics show cumulative count of Article Views (full-text article views including HTML views, PDF and ePub downloads, according to the available data) and Abstracts Views on Vision4Press platform.
Data correspond to usage on the plateform after 2015. The current usage metrics is available 48-96 hours after online publication and is updated daily on week days.
Initial download of the metrics may take a while.