Fig. 7
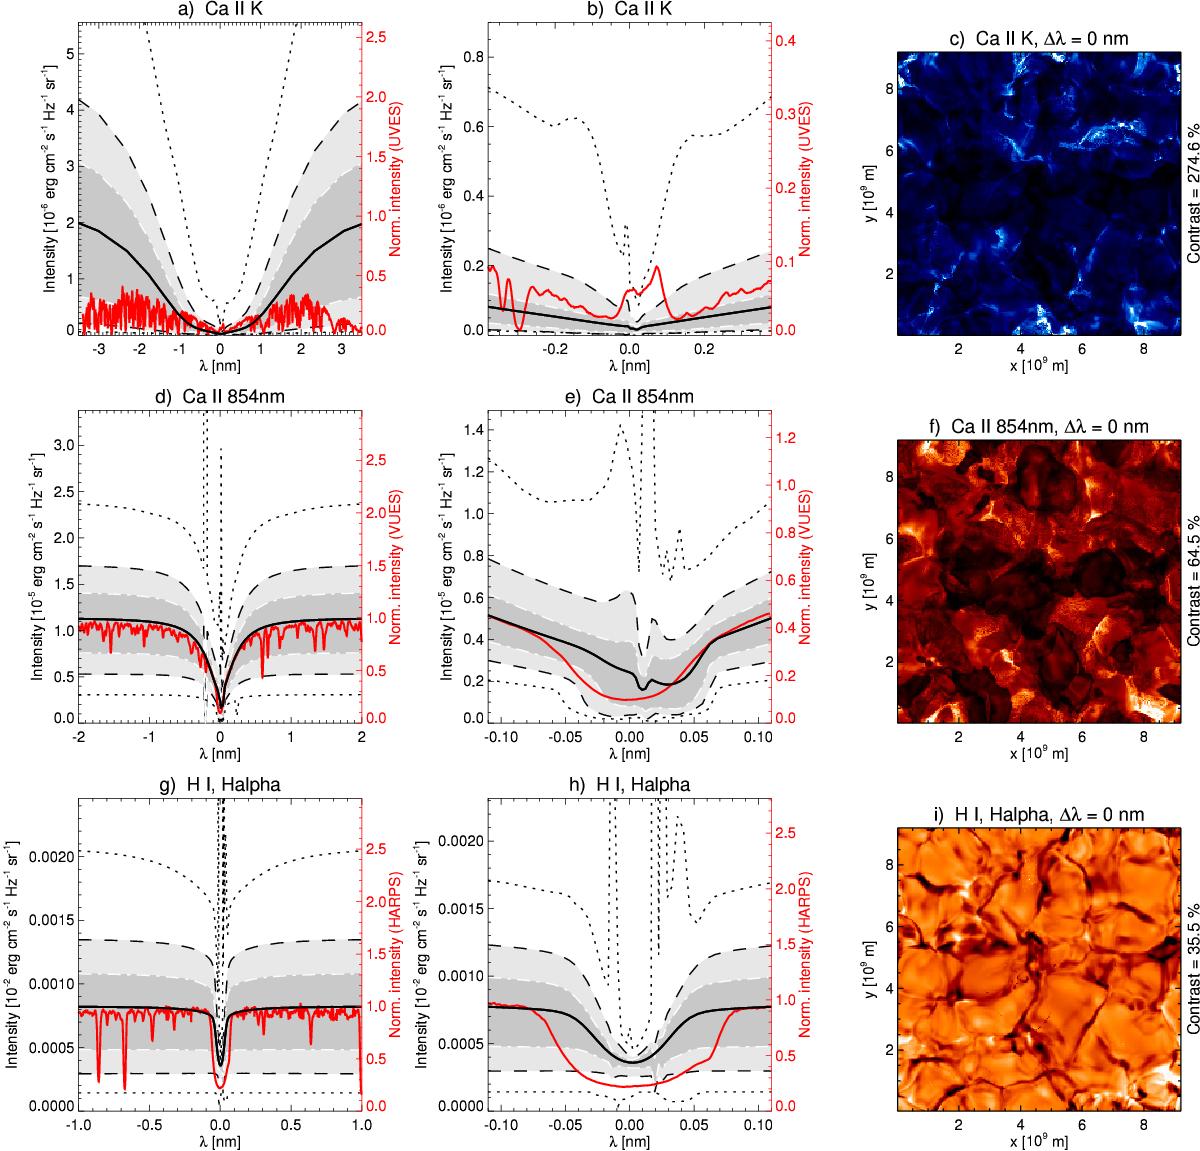
Results of radiative transfer calculations with the MULTI non-LTE code for the selected model snapshot for three different spectral lines: Ca II K (top row), Ca II 854.2 nm (middle row), and Hα (bottom row). For each row, the leftmost panel shows the horizontally averaged spectral line profile (thick solid line), the 10th and 90th percentiles (white dot-dashed with enclosed dark grey shaded area), the 1st and 99th percentiles (dashed with enclosed light grey shaded area), and the extreme values (dotted) found for that model snapshot. The same plots are repeated in the middle column, but for a narrower wavelength range around the line core. For comparison, normalised observed spectra for α Tau are shown as red lines in the left and middle column: UVES POP data (Bagnulo et al. 2003) in panels a−b, VUES data in panels d−e (Dobrovolskas et al., in prep.), and HARPS data in panels g−h (Blanco-Cuaresma et al. 2014). The red axis is to the right of the panels. The horizontally resolved intensity maps for the (nominal) line core wavelength are shown in the rightmost column for a view from the top of the model, thus corresponding to stellar disk centre.
Current usage metrics show cumulative count of Article Views (full-text article views including HTML views, PDF and ePub downloads, according to the available data) and Abstracts Views on Vision4Press platform.
Data correspond to usage on the plateform after 2015. The current usage metrics is available 48-96 hours after online publication and is updated daily on week days.
Initial download of the metrics may take a while.