Free Access
Fig. 6
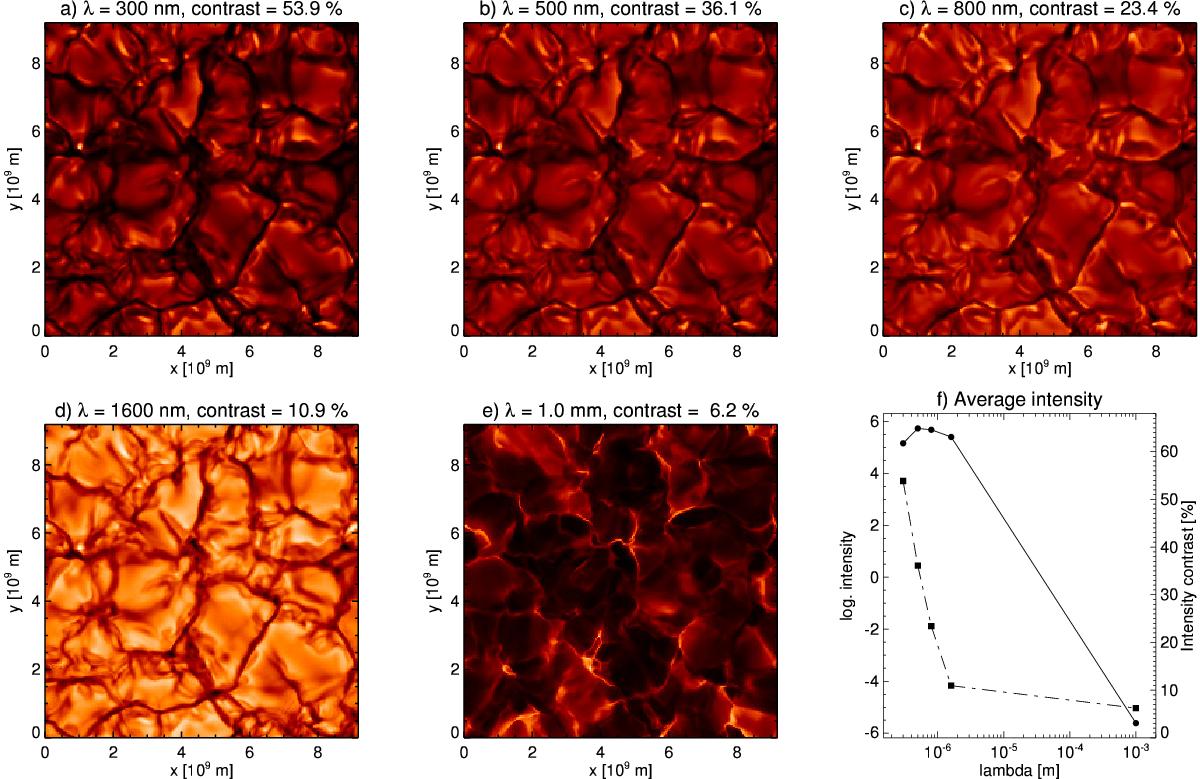
Emergent continuum intensity for a selected simulation snapshot at different wavelengths: a) 300 nm, b) 500 nm, c) 800 nm, d) 1.6 μm, and e) 1.0 mm. Panel f shows the average intensity (solid line with circles) and the corresponding intensity contrast (dot-dashed line with squares) of the maps displayed in panels a–e.
Current usage metrics show cumulative count of Article Views (full-text article views including HTML views, PDF and ePub downloads, according to the available data) and Abstracts Views on Vision4Press platform.
Data correspond to usage on the plateform after 2015. The current usage metrics is available 48-96 hours after online publication and is updated daily on week days.
Initial download of the metrics may take a while.