Fig. 5
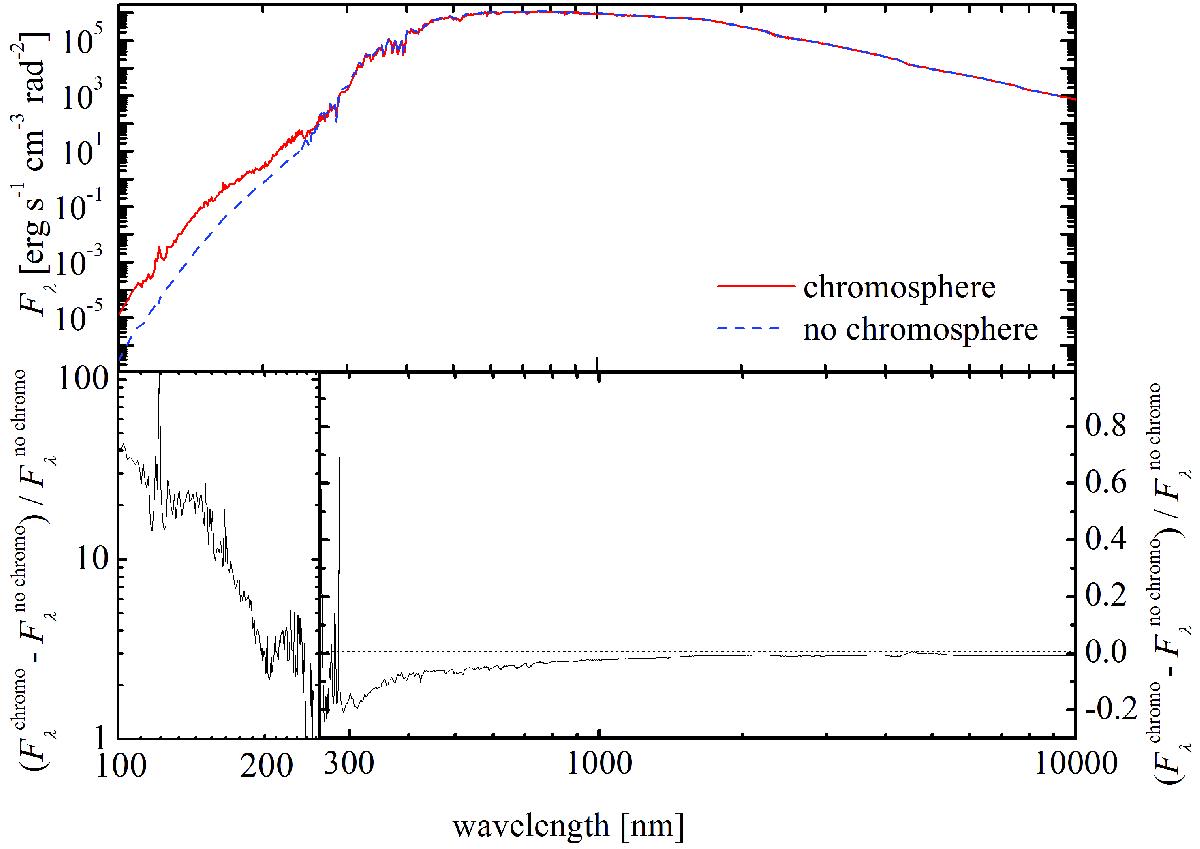
Top: spectral energy distributions (SEDs) of the red giant models with and without chromosphere. The blue line shows the average SED of the model without chromosphere computed using an ensemble of 20 model snapshots obtained at different instants in time. The red line shows the SED of the model with chromosphere computed using the single snapshot shown in Fig. 1. Bottom: relative difference between the flux of the models with and without chromosphere. The vertical scale is different in the wavelength region <270 nm.
Current usage metrics show cumulative count of Article Views (full-text article views including HTML views, PDF and ePub downloads, according to the available data) and Abstracts Views on Vision4Press platform.
Data correspond to usage on the plateform after 2015. The current usage metrics is available 48-96 hours after online publication and is updated daily on week days.
Initial download of the metrics may take a while.