Fig. 4
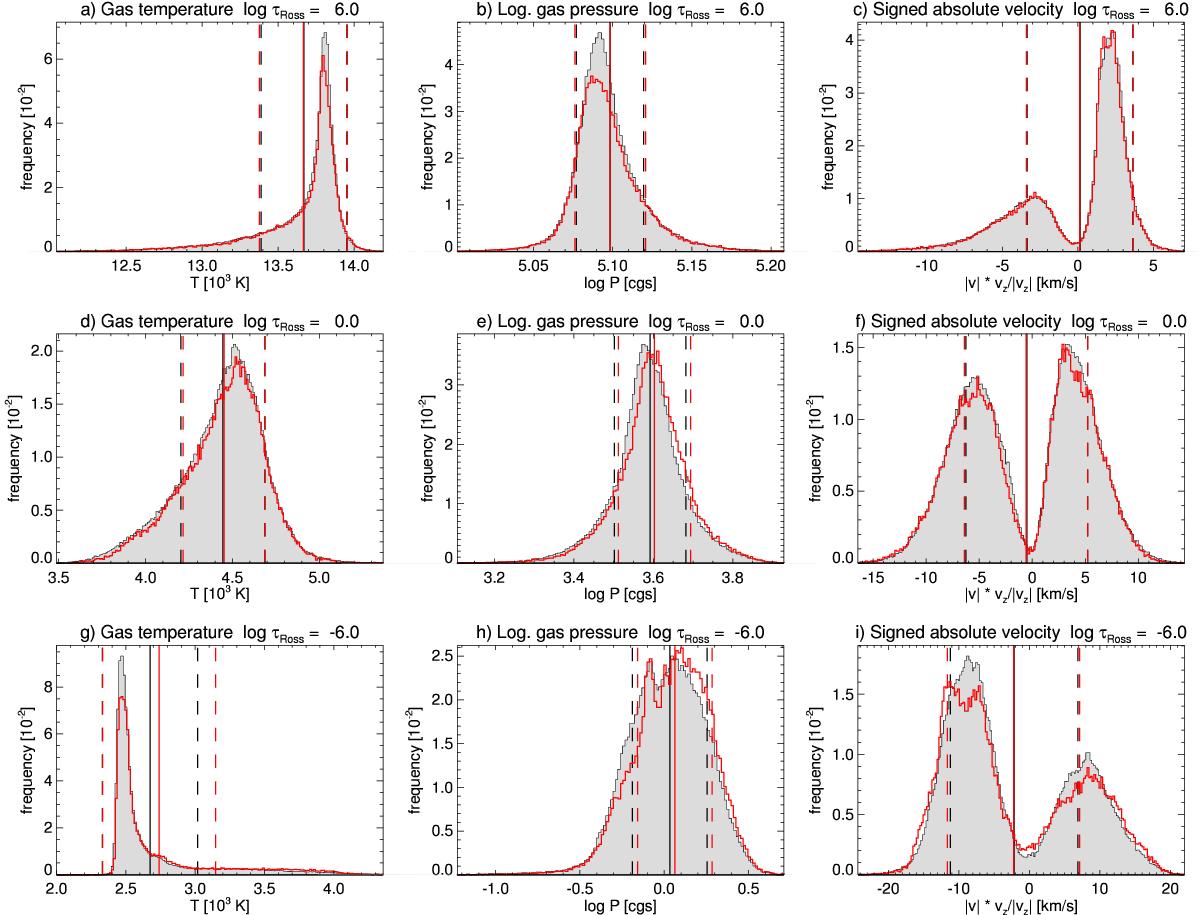
Histograms for the horizontal cross-sections displayed in Fig. 1 for the same model snapshot (red) and for snapshots stretching over the second half of the simulation (grey/black). The columns are in the same order as in Fig. 1: gas temperature, logarithm gas pressure, and the product of the absolute velocity and the sign of the vertical velocity component, all on planes of equal optical depth. The rows are, from top to bottom: convection zone (log τRoss = 6.0), photosphere (log τRoss = 0.0), and chromosphere (log τRoss = − 6.0). The solid vertical lines mark the average values, whereas the dashed lines mark the average plus/minus one standard deviation.
Current usage metrics show cumulative count of Article Views (full-text article views including HTML views, PDF and ePub downloads, according to the available data) and Abstracts Views on Vision4Press platform.
Data correspond to usage on the plateform after 2015. The current usage metrics is available 48-96 hours after online publication and is updated daily on week days.
Initial download of the metrics may take a while.