Fig. 3
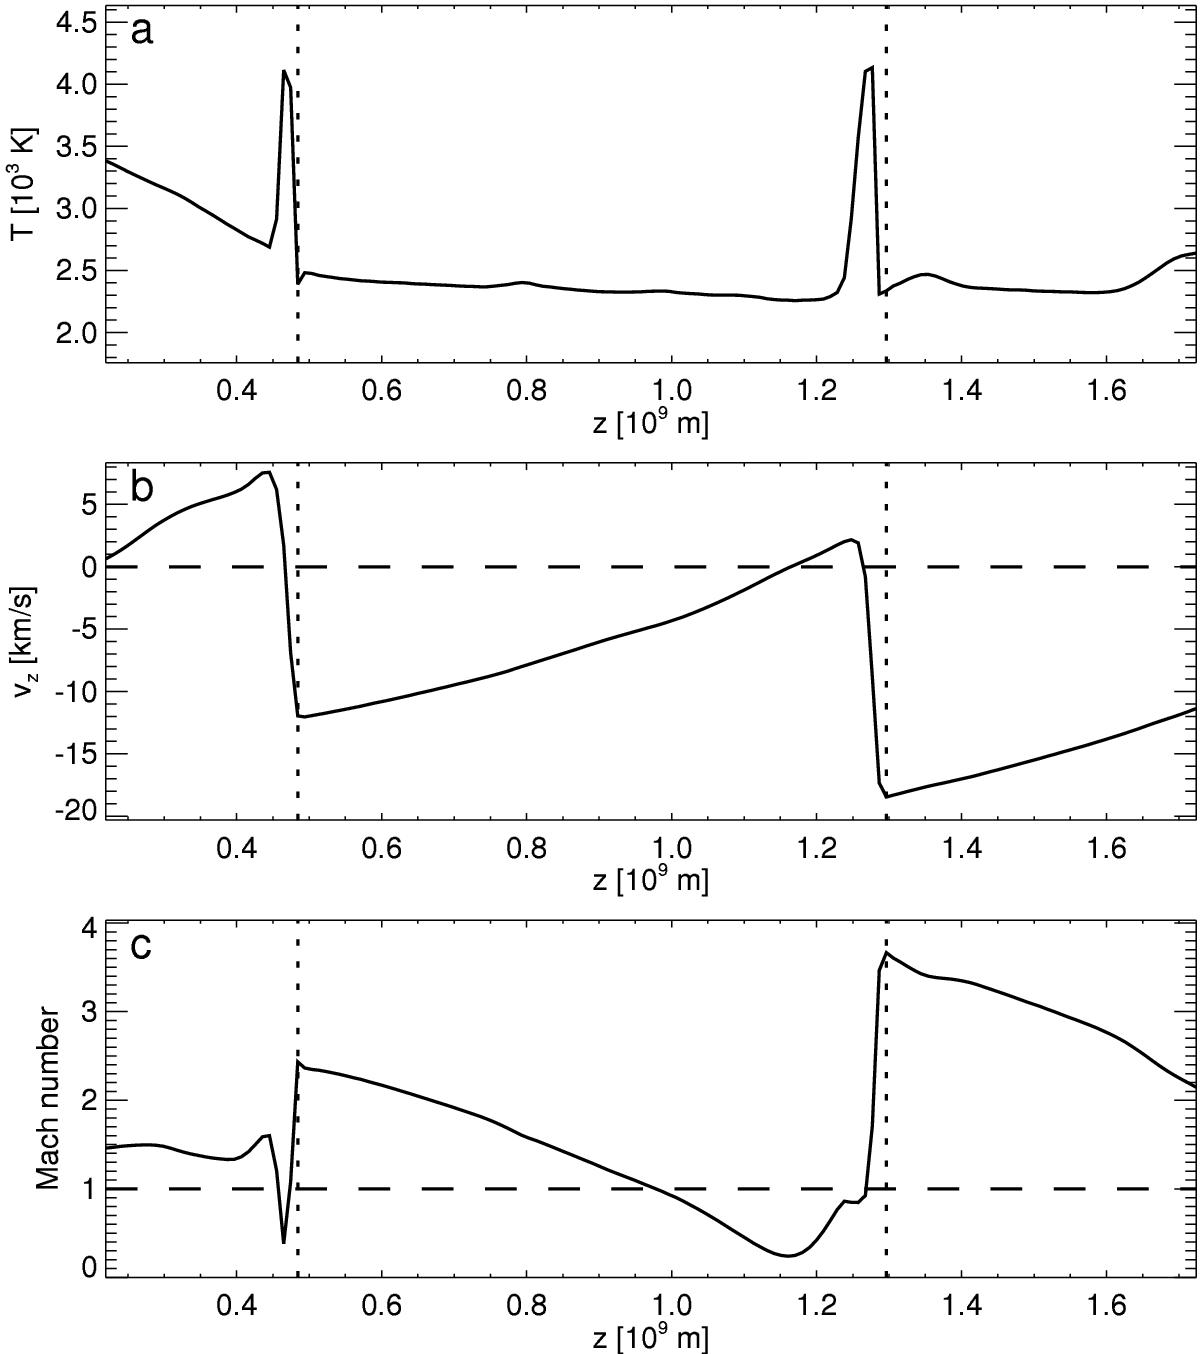
Vertical cross-section along the height axis z through the same model snapshot as in Figs. 1 and 2 at the horizontal position [ x,y ] = [ 3.31 × 10⁹ m,0.58 × 109 m ]. The following physical quantities are displayed: a) gas temperature, b) vertical velocity, and c) Mach number. The dotted vertical lines mark the positions in two major shock fronts, where the shocks meet downfalling gas.
Current usage metrics show cumulative count of Article Views (full-text article views including HTML views, PDF and ePub downloads, according to the available data) and Abstracts Views on Vision4Press platform.
Data correspond to usage on the plateform after 2015. The current usage metrics is available 48-96 hours after online publication and is updated daily on week days.
Initial download of the metrics may take a while.