Fig. 2
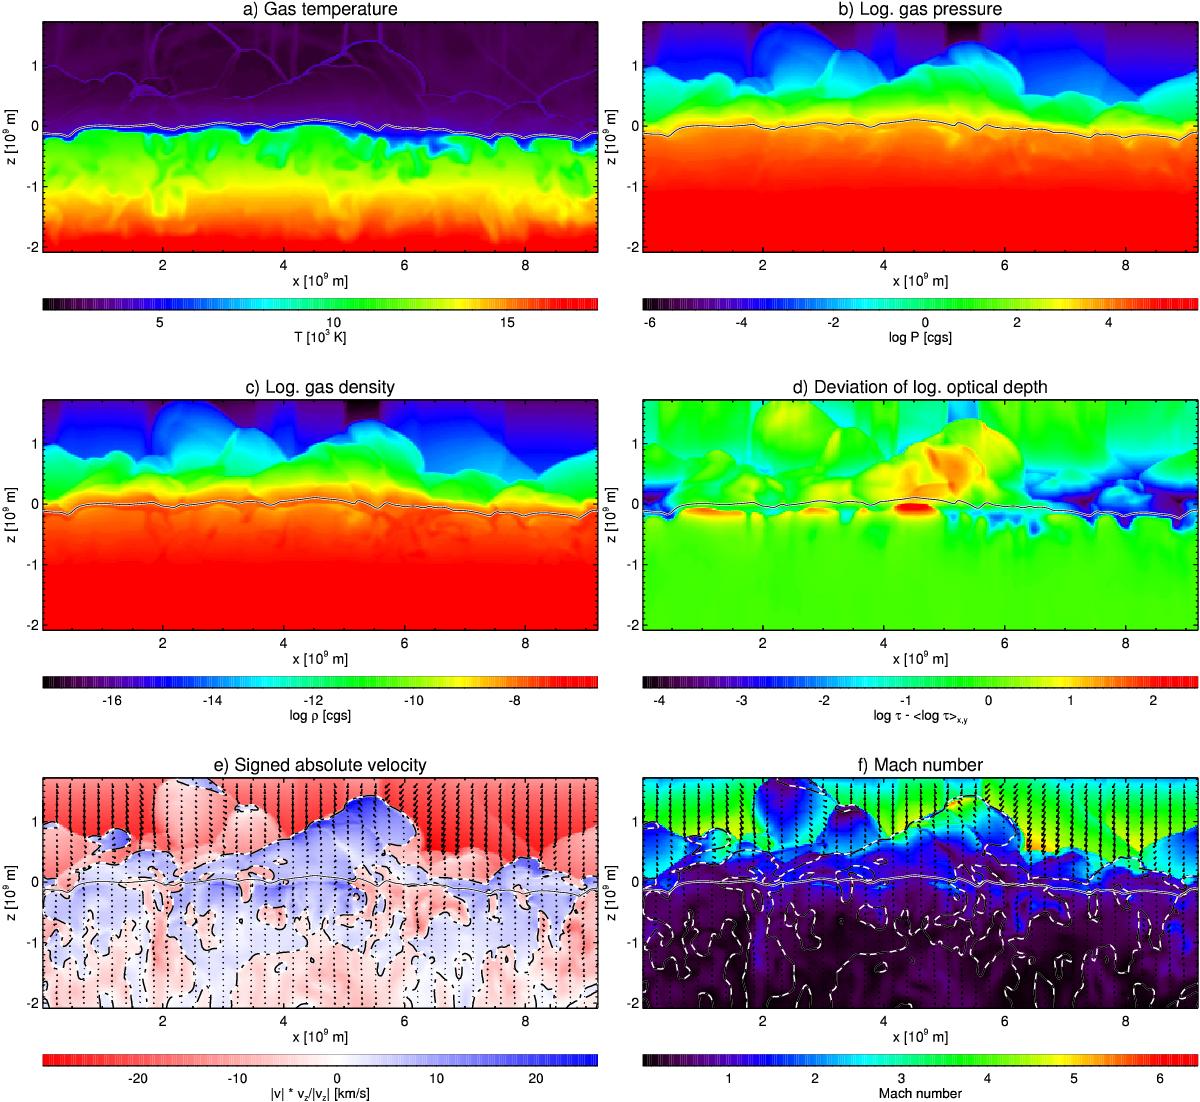
Vertical cross-sections along the x-axis at y = 0.577 × 10⁹ m through the same model snapshot as in Fig. 1, displaying the following physical quantities: a) gas temperature, b) logarithmic gas pressure, c) logarithmic gas density, d) the difference between the local logarithmic optical depth and its horizontal average (log τRoss(x,z) − < log τRoss>x,y), e) absolute velocity multiplied by the sign of the vertical velocity component, and f) the Mach number. In panels e and d, streamlines for the flow field in the view plane and a dot-dashed contour for v = 0 km s-1, which thus divide upflows (v> 0) from downflows (v< 0), are plotted. The height of optical depth unity is represented by the black solid line around z = 0 m, which thus marks the boundary between photosphere and convection zone.
Current usage metrics show cumulative count of Article Views (full-text article views including HTML views, PDF and ePub downloads, according to the available data) and Abstracts Views on Vision4Press platform.
Data correspond to usage on the plateform after 2015. The current usage metrics is available 48-96 hours after online publication and is updated daily on week days.
Initial download of the metrics may take a while.