Fig. 1
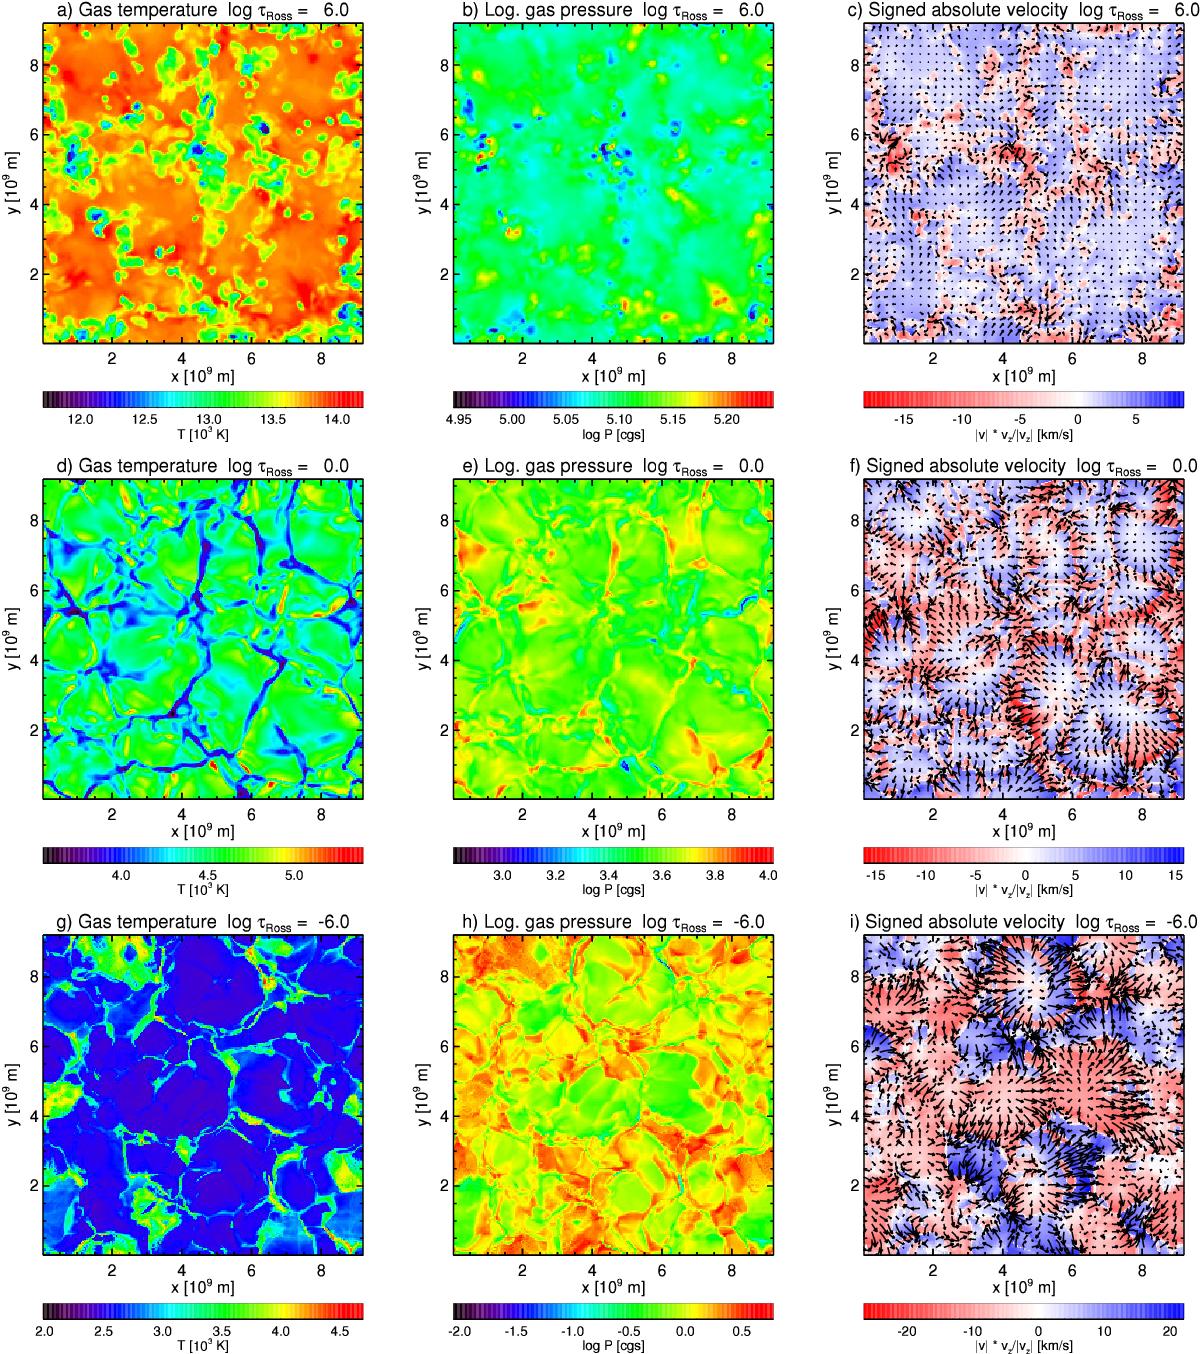
Selected physical quantities in horizontal cross-sections through a single model snapshot (i.e. 3D model structure computed at a single instant in time) of the red giant model atmosphere after 146.8 h simulated time. The different columns show maps for the gas temperature (left), logarithm of gas pressure (middle), and the product of the absolute velocity and the sign of the vertical velocity component (right). Negative velocities are directed downwards/inwards (i.e. towards the stellar core) and positive velocities upwards/outwards. Each of these quantities is presented on planes of constant optical depth in the convection zone (top, log τRoss = 6.0), the photosphere (middle, log τRoss = 0.0), and the chromosphere (bottom, log τRoss = − 6.0). The streamlines in the right column follow the horizontal velocity field in the depicted plane.
Current usage metrics show cumulative count of Article Views (full-text article views including HTML views, PDF and ePub downloads, according to the available data) and Abstracts Views on Vision4Press platform.
Data correspond to usage on the plateform after 2015. The current usage metrics is available 48-96 hours after online publication and is updated daily on week days.
Initial download of the metrics may take a while.