Fig. 2
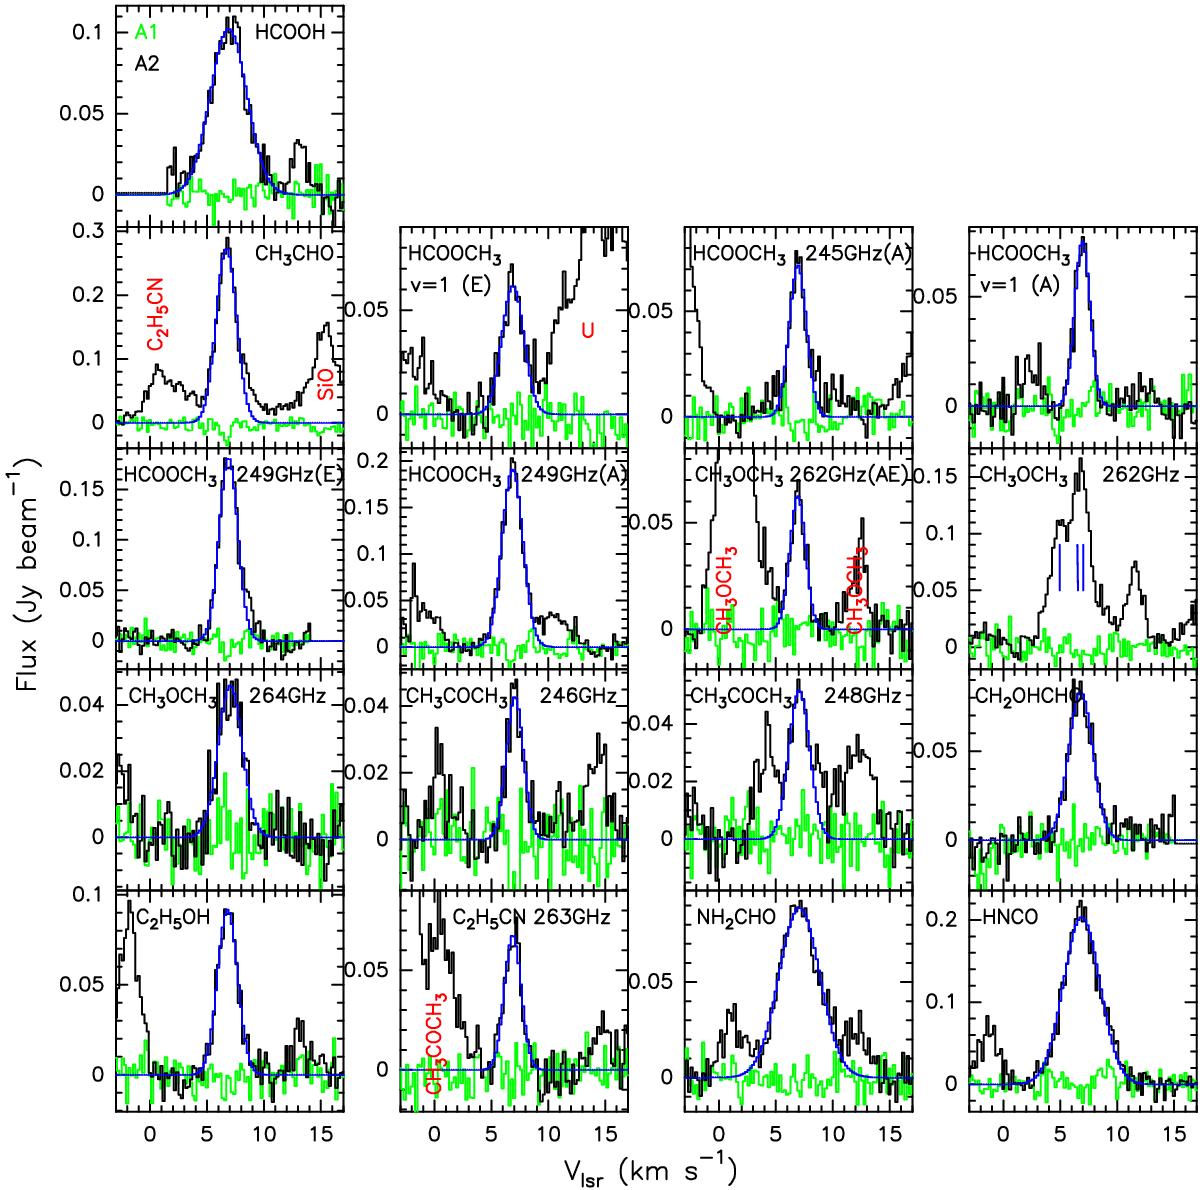
Spectra of the 17 lines from organic molecules identified in IRAS 4A with ALMA at 1.2 mm, corresponding to the continuum peak coordinates of A1 (green) and A2 (black). Except for CH3OCH3(135,8 − 134,9), whose three blended lines are indicated with vertical blue lines, the Gaussian fits to all the lines observed in A2 are depicted in blue (see Table 2). Nearby molecular lines are labelled in red.
Current usage metrics show cumulative count of Article Views (full-text article views including HTML views, PDF and ePub downloads, according to the available data) and Abstracts Views on Vision4Press platform.
Data correspond to usage on the plateform after 2015. The current usage metrics is available 48-96 hours after online publication and is updated daily on week days.
Initial download of the metrics may take a while.