Fig. 1
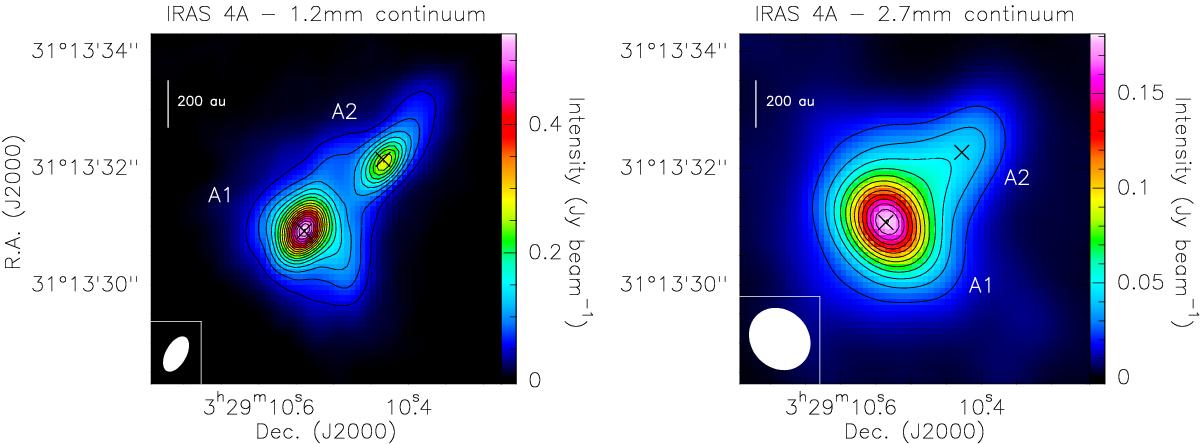
Dust continuum emission maps of IRAS 4A at 1.2 mm (left) and 2.7 mm (right). For the two maps, contours start at 50σ and increase by steps of 30σ, with σ = 0.96 mJy beam-1 and 0.44 mJy beam-1 at 1.2 and 2.7 mm, respectively. The two protostellar cores A1 and A2 are labelled and their coordinates, obtained from 2D Gaussian fits (see Table 1), are indicated with black crosses. The synthesised beams are depicted in white in the lower left corner of each panel.
Current usage metrics show cumulative count of Article Views (full-text article views including HTML views, PDF and ePub downloads, according to the available data) and Abstracts Views on Vision4Press platform.
Data correspond to usage on the plateform after 2015. The current usage metrics is available 48-96 hours after online publication and is updated daily on week days.
Initial download of the metrics may take a while.