Fig. 8
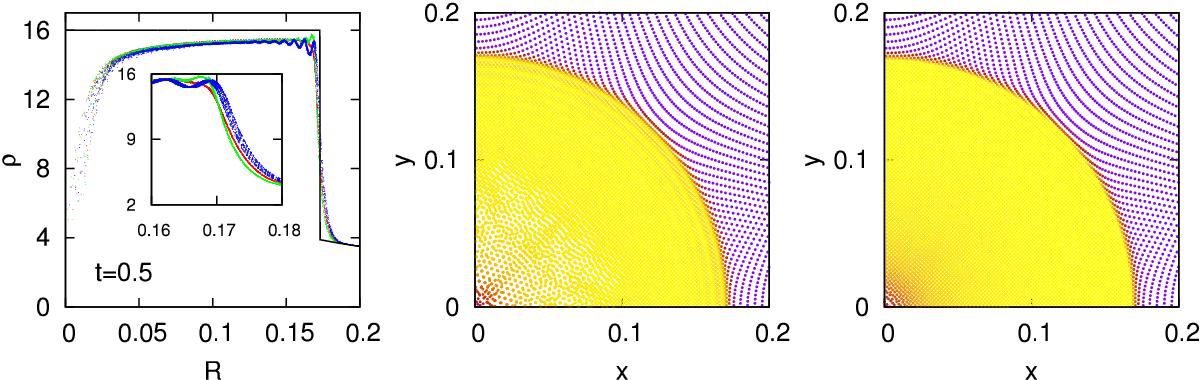
Two-dimensional wall-shock test at time t = 0.5. Left: density profiles for models described in Table 4: WHS1 (red), WHS2 (green), and WHSG (blue) in dots. The analytic result is the solid black line. The central panel depicts the particle distribution with density as color at t = 0.5 as obtained with GADGET-2 whereas the last panel is that of model WHS2. We note how WHS2 achieves lower particle disorder in the central region, and smaller density oscillations at the shock position than GADGET-2.
Current usage metrics show cumulative count of Article Views (full-text article views including HTML views, PDF and ePub downloads, according to the available data) and Abstracts Views on Vision4Press platform.
Data correspond to usage on the plateform after 2015. The current usage metrics is available 48-96 hours after online publication and is updated daily on week days.
Initial download of the metrics may take a while.