Fig. 4
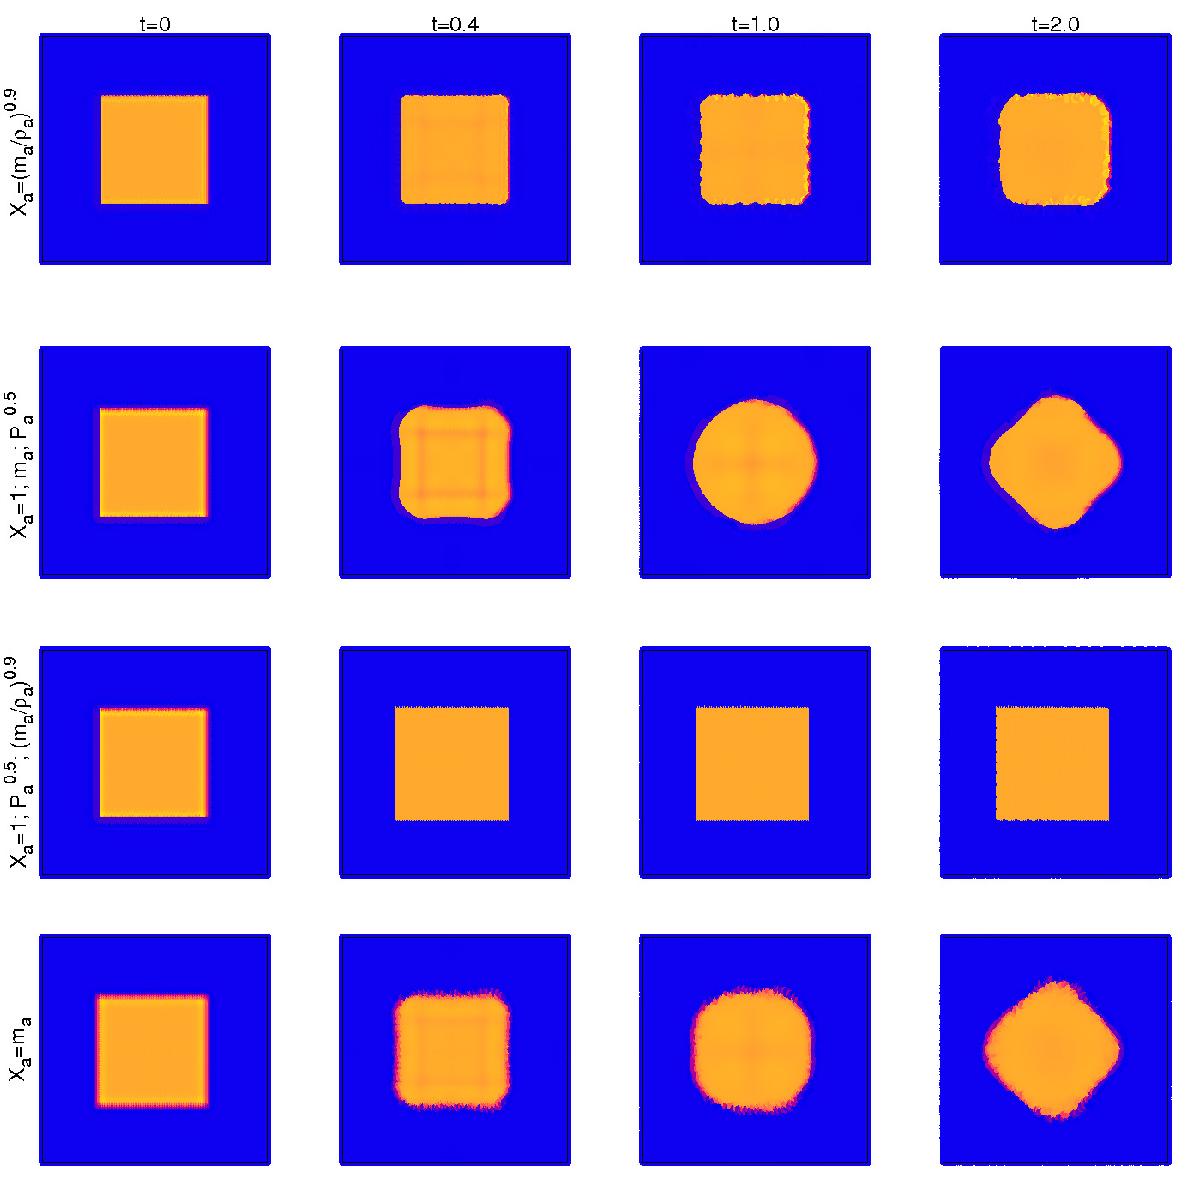
The unmixed isobaric two-fluid test at times t = 0, t = 0.4, t = 1 and t = 2 (columns from left to right) calculated with different volume elements. The initial model is that of two nested squares with density contrast of four (the one with higher density being the inner yellow square). First and second rows use particles with identical mass but unevenly spaced grid, while the opposite applies for the two last rows. The first row depicts the evolution with the volume estimator ![]() (p = 0.9). The second row is the same, but using either Xa = 1, ma, and
(p = 0.9). The second row is the same, but using either Xa = 1, ma, and ![]() (k = 0.5) (all three giving similar results). The evolution shown in the third row was calculated using either
(k = 0.5) (all three giving similar results). The evolution shown in the third row was calculated using either ![]() , and
, and ![]() , while the outcome using Xa = ma is shown in the fourth row.
, while the outcome using Xa = ma is shown in the fourth row.
Current usage metrics show cumulative count of Article Views (full-text article views including HTML views, PDF and ePub downloads, according to the available data) and Abstracts Views on Vision4Press platform.
Data correspond to usage on the plateform after 2015. The current usage metrics is available 48-96 hours after online publication and is updated daily on week days.
Initial download of the metrics may take a while.