Free Access
Fig. 23
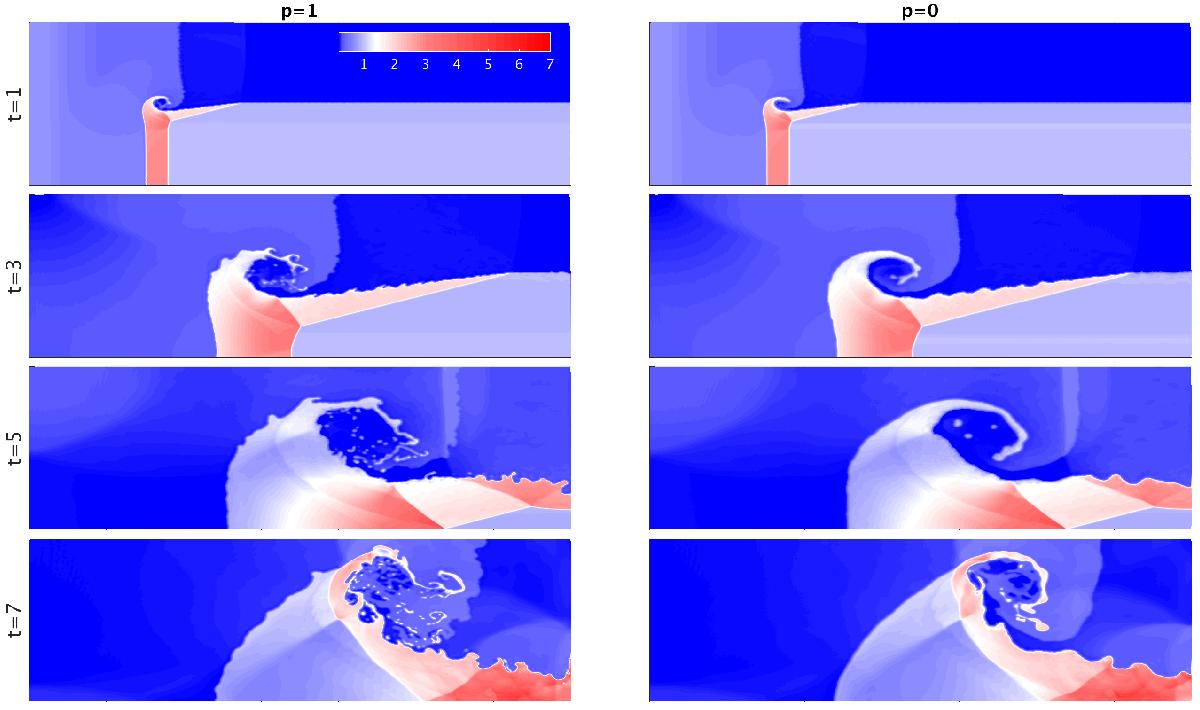
Color-map of the mass density in the triple-point shock test. Each row shows a snapshot at a different time, while each column corresponds to a different VE. The column on the left was calculated with Xa = ( ⟨ m/ρ ⟩ a)p and p = 1, while the one on the right corresponds to Xa = 1 (i.e., standard VE).
Current usage metrics show cumulative count of Article Views (full-text article views including HTML views, PDF and ePub downloads, according to the available data) and Abstracts Views on Vision4Press platform.
Data correspond to usage on the plateform after 2015. The current usage metrics is available 48-96 hours after online publication and is updated daily on week days.
Initial download of the metrics may take a while.