Fig. 16
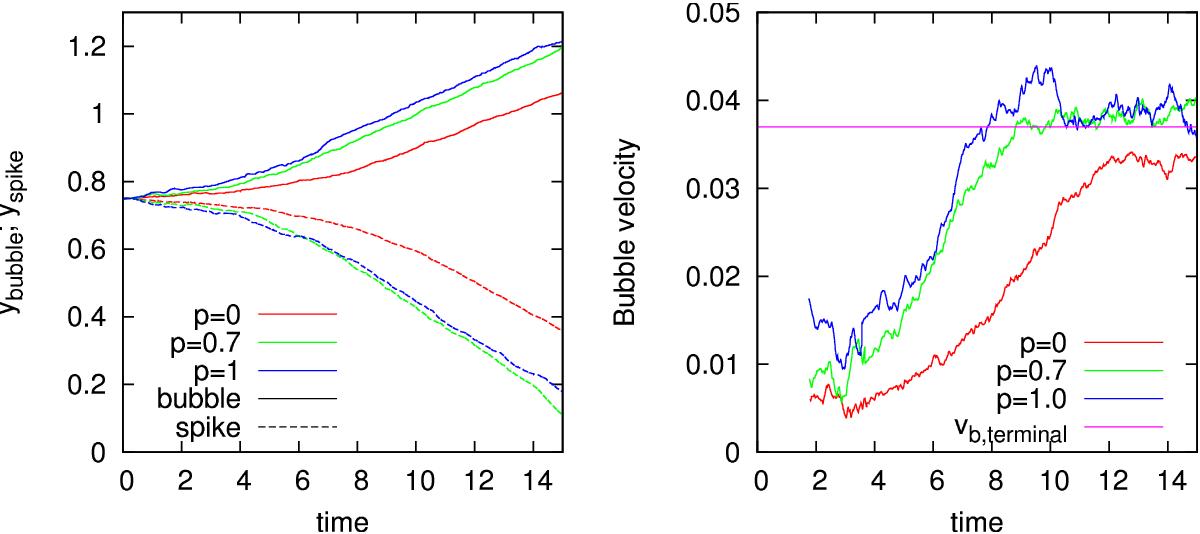
Rayleigh-Taylor test in 2D for models RT3 (p = 0, red lines), RT4 (p = 0.7, green lines), and RT5 (p = 1, blue lines). In the left panel we show the time evolution of the tips of the bubble (solid lines) and the spikes (dashed). From these it is clear that the inclusion of the new VE elements enhances the growth of the instability in the linear stage. Once the non-linear stage is reached all models grow at similar rates. It is worth noting here that simulations without IAD0 and standard VE (not shown) failed to develop the RT instability. In the panel on the right, we show the time evolution of the bubble velocity. It can be seen how a plateau is reached by all three models, which is closer to the expected terminal velocity (pink solid line) for the models using the new volume elements.
Current usage metrics show cumulative count of Article Views (full-text article views including HTML views, PDF and ePub downloads, according to the available data) and Abstracts Views on Vision4Press platform.
Data correspond to usage on the plateform after 2015. The current usage metrics is available 48-96 hours after online publication and is updated daily on week days.
Initial download of the metrics may take a while.