Free Access
Fig. 12
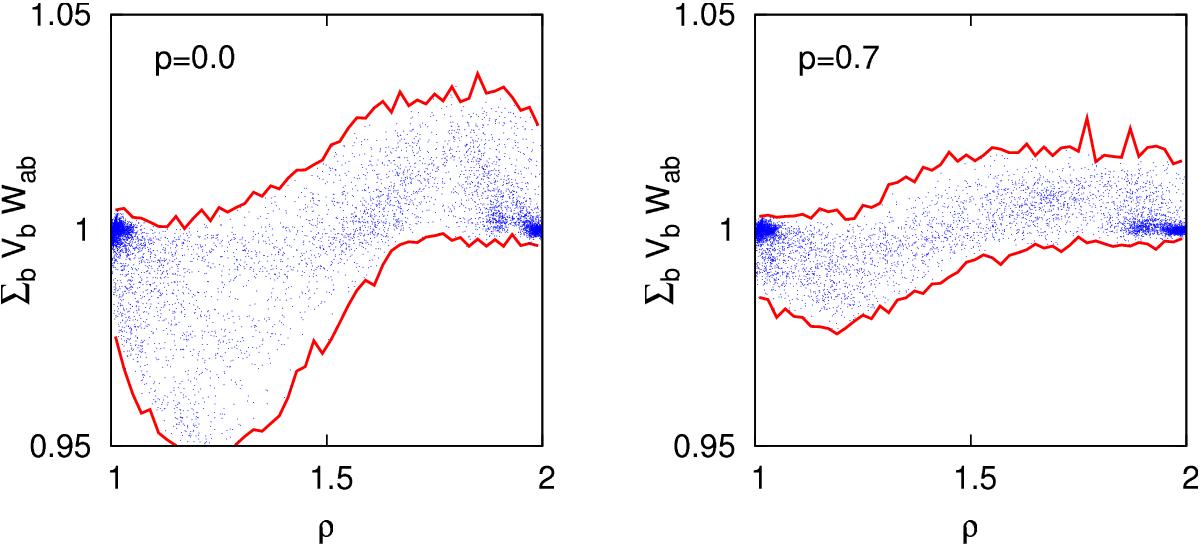
Kernel normalization of models KH1 (left) and KH2 (right) of Table 5 at t = 2.5. The dispersion of ∑ bVbWab around unity is shown for two options of the exponent of the volume estimator, Xa = (ma/ρa)p, p = 0 (left) and p = 0.7 (right). Solid red lines are maximum and minimum values to help as a visual aid.
Current usage metrics show cumulative count of Article Views (full-text article views including HTML views, PDF and ePub downloads, according to the available data) and Abstracts Views on Vision4Press platform.
Data correspond to usage on the plateform after 2015. The current usage metrics is available 48-96 hours after online publication and is updated daily on week days.
Initial download of the metrics may take a while.