Free Access
Fig. 10
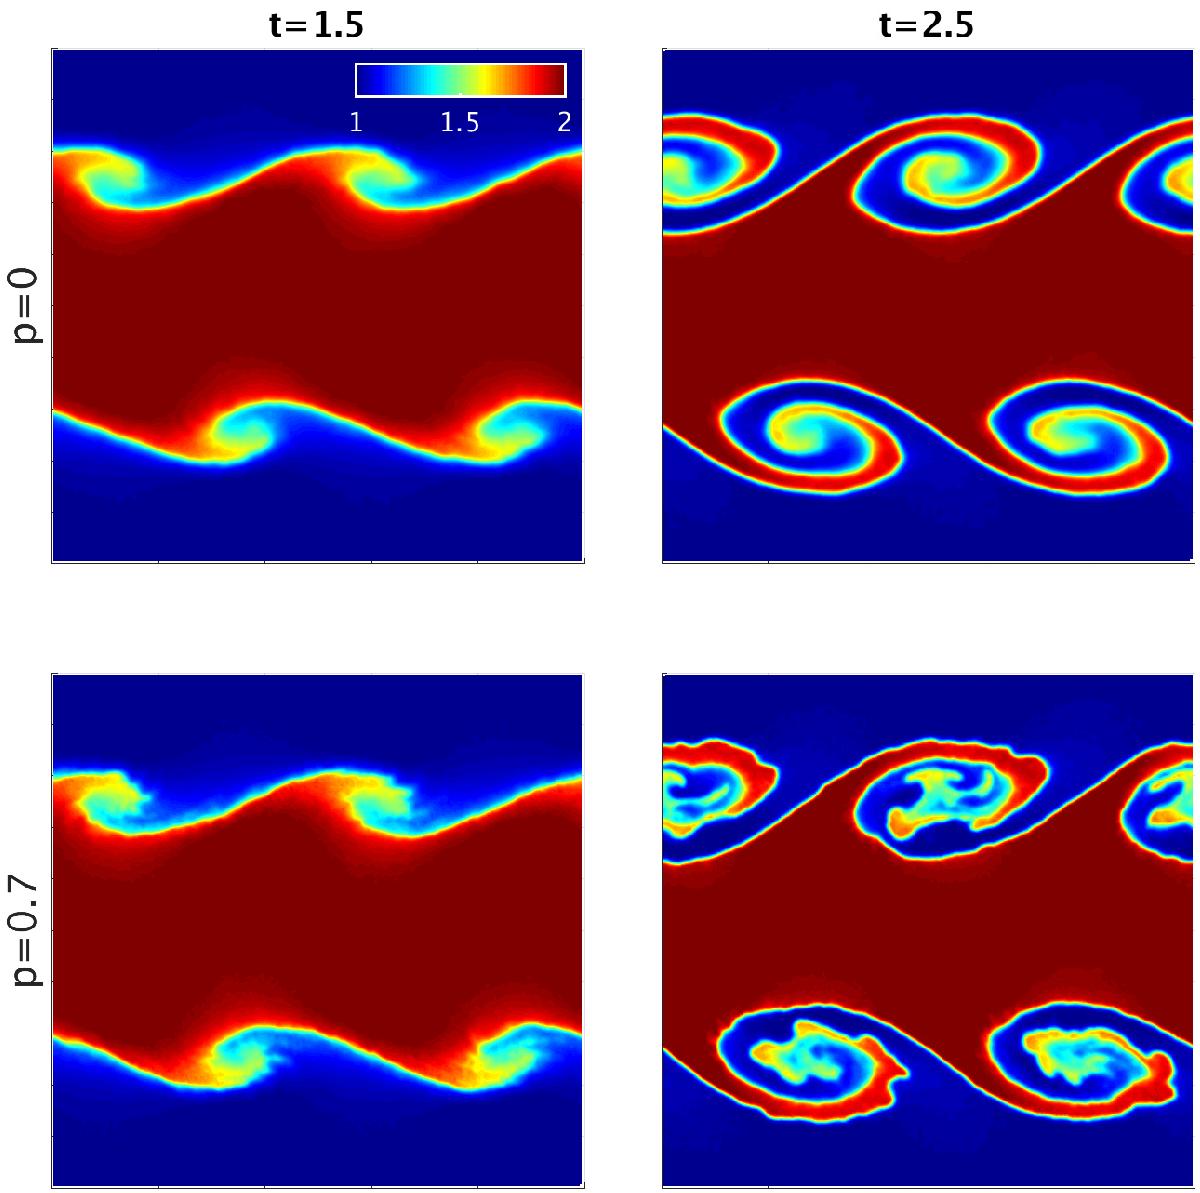
Density color-map depicting the evolution of the Kelvin-Helmholtz instability for models KH1 (p = 0, upper panels) and KH2 (p = 0.7, lower panels) of Table 5. Each snapshot gives the density color-map at times t = 1.5 (left) and t = 2.5 (right).
Current usage metrics show cumulative count of Article Views (full-text article views including HTML views, PDF and ePub downloads, according to the available data) and Abstracts Views on Vision4Press platform.
Data correspond to usage on the plateform after 2015. The current usage metrics is available 48-96 hours after online publication and is updated daily on week days.
Initial download of the metrics may take a while.