Free Access
Fig. 4
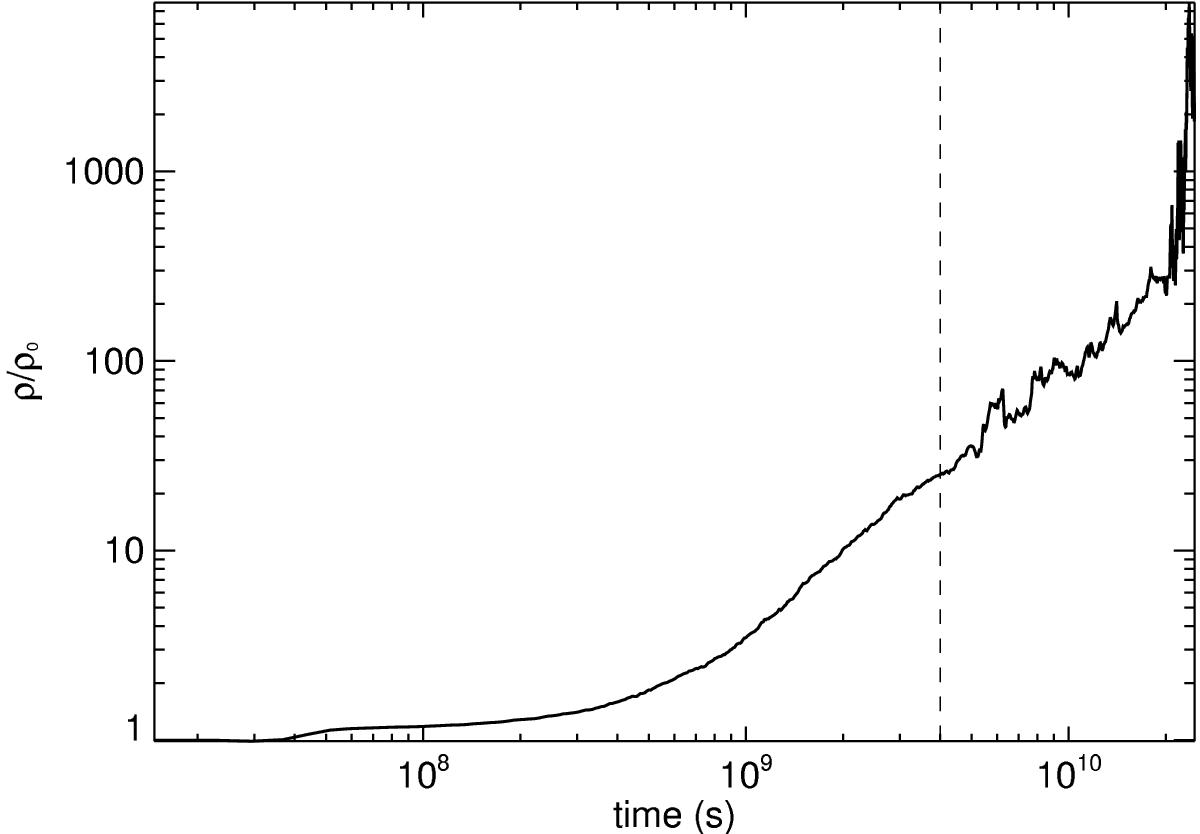
Normalized mean rest-mass density across the whole simulated jet cross-section for simulation SW2c, at z = 1.1 × 1018 cm (coinciding with half the grid). The dashed line indicates the approximate time at which the transition to phase 2 takes place in the simulation.
Current usage metrics show cumulative count of Article Views (full-text article views including HTML views, PDF and ePub downloads, according to the available data) and Abstracts Views on Vision4Press platform.
Data correspond to usage on the plateform after 2015. The current usage metrics is available 48-96 hours after online publication and is updated daily on week days.
Initial download of the metrics may take a while.