Fig. 9
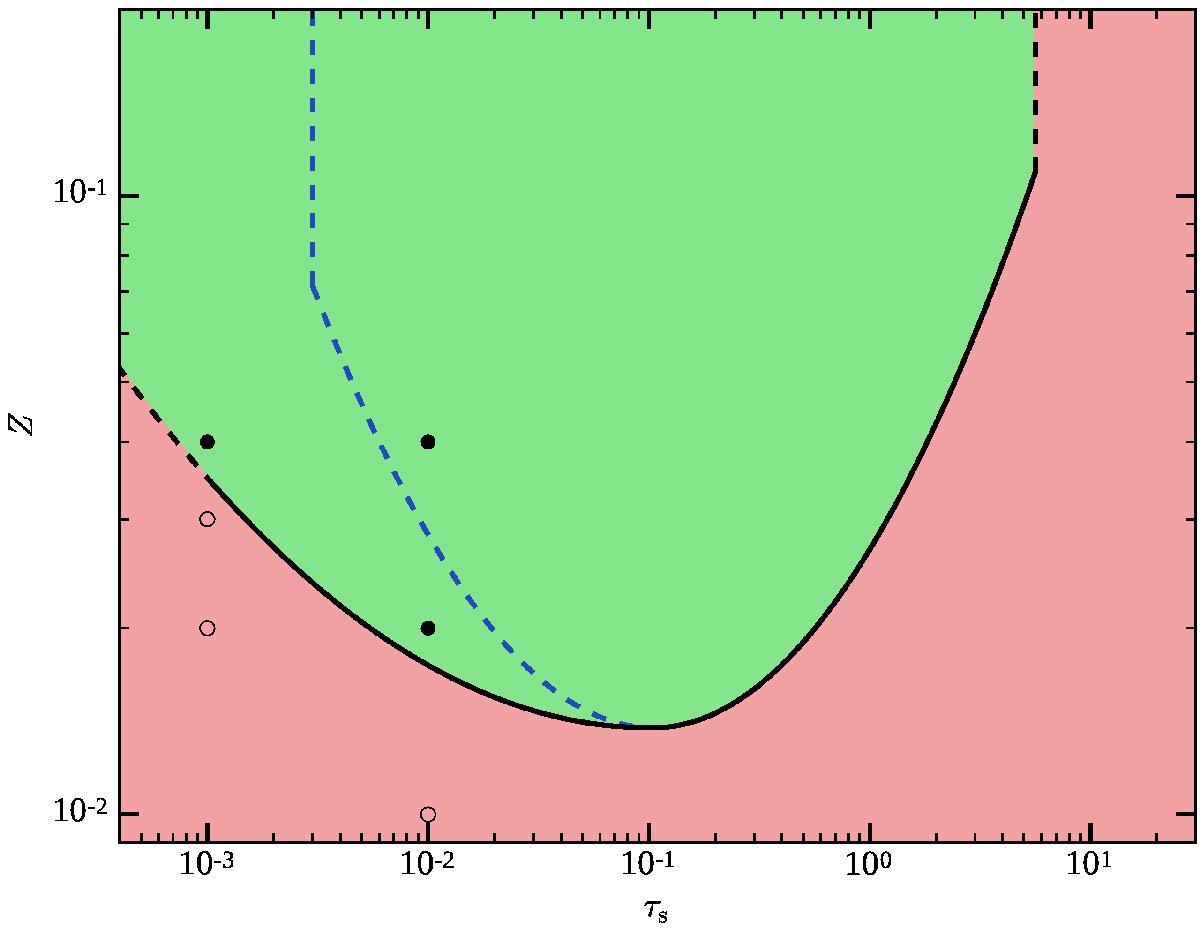
Revised critical solid abundance as a function of the dimensionless stopping time τs from Carrera et al. (2015). The filled and open circles show our models with and without significant radial concentration of solids, respectively. The solid black line for τs ≳ 10-1 and the dashed blue line for τs ≲ 10-1 are the unmodified critical curve from Carrera et al. (2015). The black solid line for τs ≲ 10-1 shows the revised part of the critical curve, where the black dashed line is the extrapolation of it. For solid abundances Z above the black line (green region), spontaneous concentration of solid particles by the streaming instability can occur.
Current usage metrics show cumulative count of Article Views (full-text article views including HTML views, PDF and ePub downloads, according to the available data) and Abstracts Views on Vision4Press platform.
Data correspond to usage on the plateform after 2015. The current usage metrics is available 48-96 hours after online publication and is updated daily on week days.
Initial download of the metrics may take a while.