Fig. 7
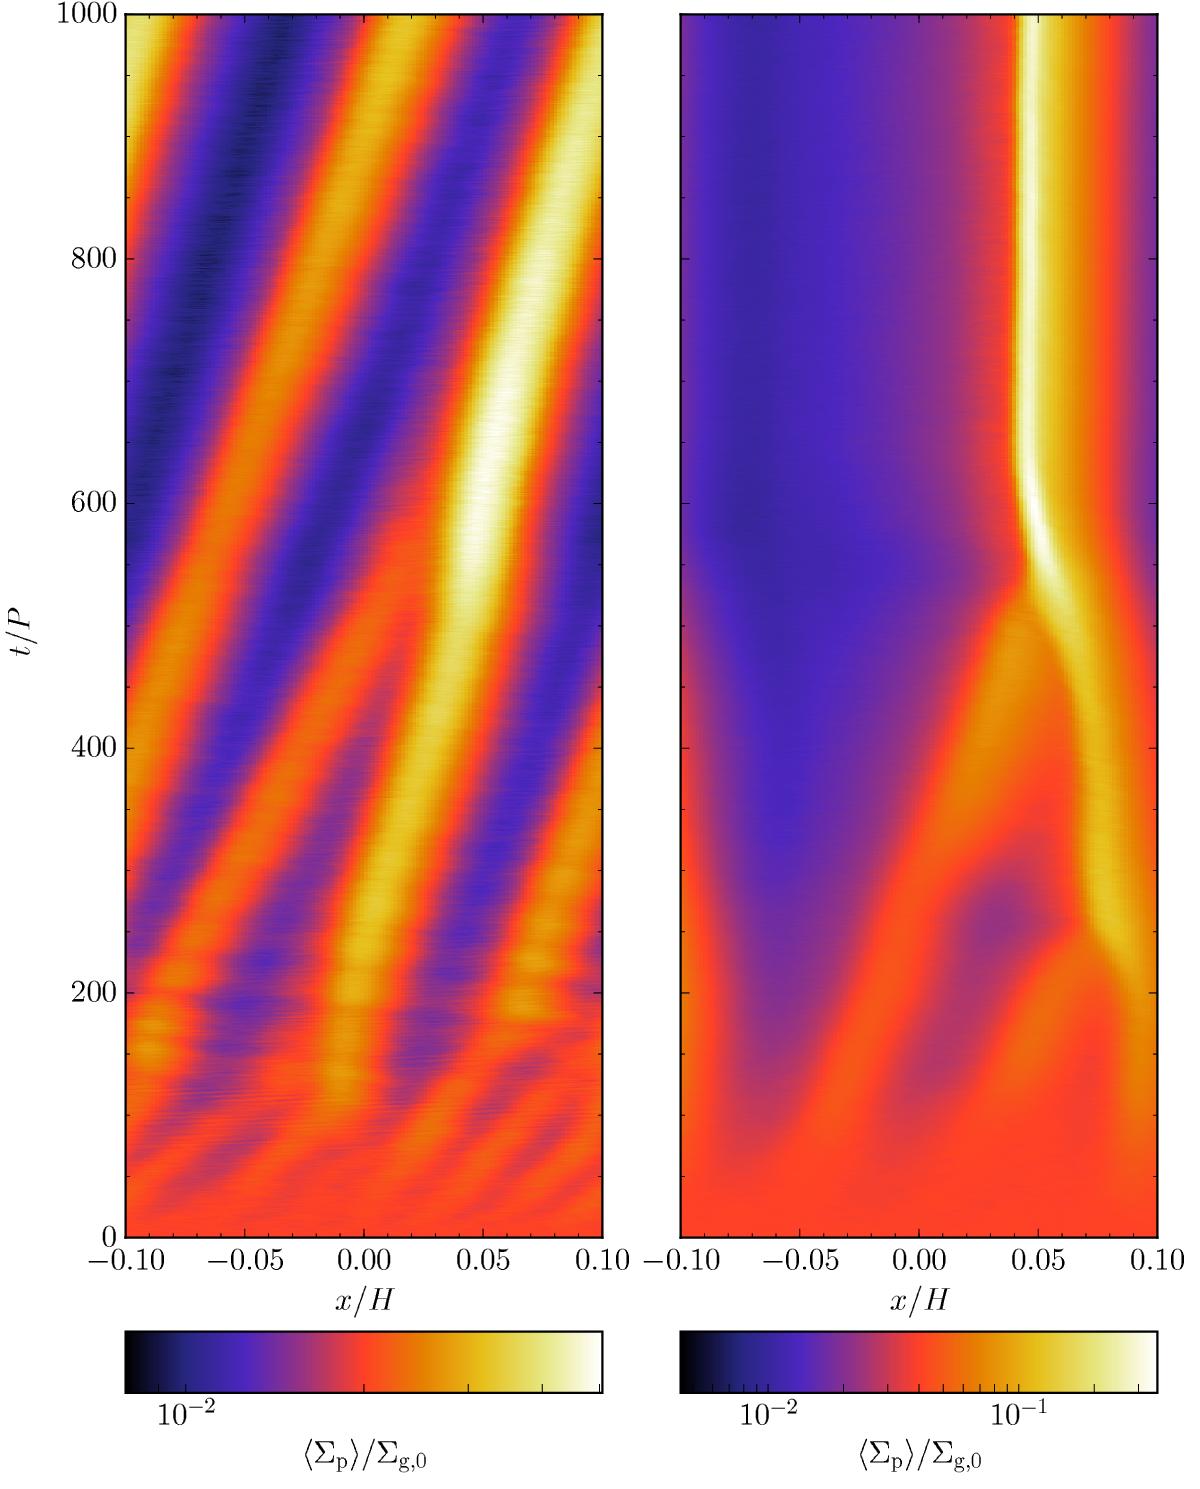
Evolution of the radial concentration of the particle layer for two 3D models. The colors show the azimuthal average of the column density of the particles Σp as a function of radial position x and time t, where Σp, x, and t are normalized by the initial gas column density Σg,0, the vertical scale height of the gas H, and the local orbital period P, respectively. The left panel has particles of dimensionless stopping time τs = 10-2 and a solid abundance of Z = 0.02, while the right panel has τs = 10-3 and Z = 0.04. Both models have the same computational domain of 0.2H on each side and resolution of 640H-1.
Current usage metrics show cumulative count of Article Views (full-text article views including HTML views, PDF and ePub downloads, according to the available data) and Abstracts Views on Vision4Press platform.
Data correspond to usage on the plateform after 2015. The current usage metrics is available 48-96 hours after online publication and is updated daily on week days.
Initial download of the metrics may take a while.