Fig. 5
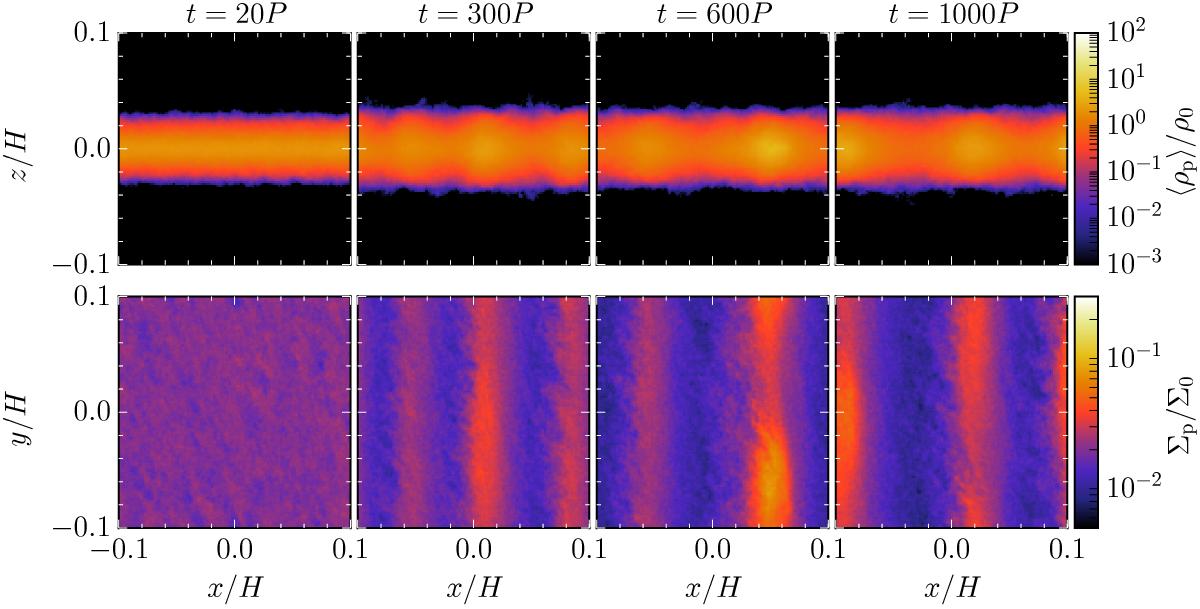
Side and top views of the particle layer for a 3D model with particles of τs = 10-2 and a solid abundance of Z = 0.02. The time t in terms of the local orbital period P increases from left to right. The top panels show the azimuthal average of the particle density ρp with respect to the initial gas density in the mid-plane ρ0, while the bottom panels show the column density of solids Σp with respect to the initial column density of gas Σ0. The coordinates are normalized by the vertical scale height of the gas H. The model has a computational domain of 0.2H on each side and a resolution of 640H-1.
Current usage metrics show cumulative count of Article Views (full-text article views including HTML views, PDF and ePub downloads, according to the available data) and Abstracts Views on Vision4Press platform.
Data correspond to usage on the plateform after 2015. The current usage metrics is available 48-96 hours after online publication and is updated daily on week days.
Initial download of the metrics may take a while.