Fig. 3
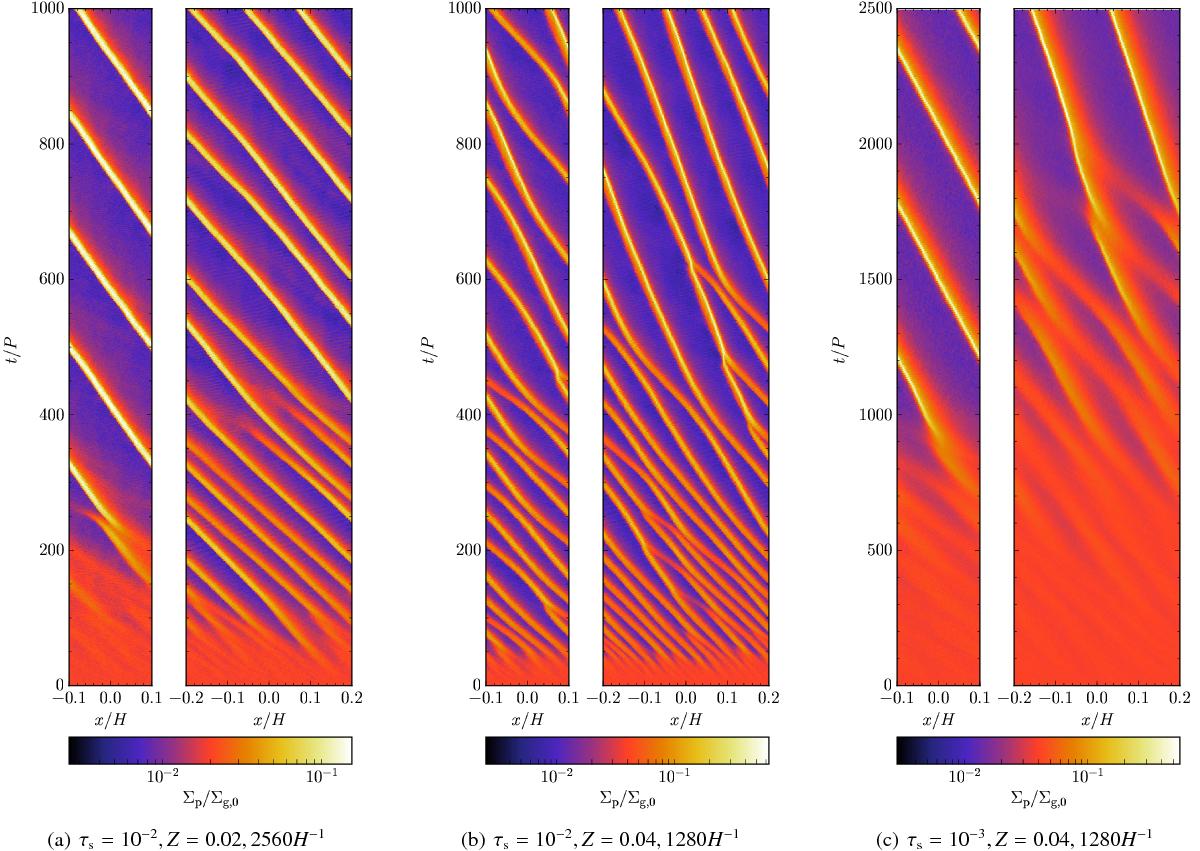
Evolution of the radial concentration of the particle layer for our 2D models that trigger strong concentration of solids. Three cases of different dimensionless stopping time τs, solid abundance Z, and model resolution are presented. The colors show the column density of the particles Σp as a function of radial position x and time t, where Σp, x, and t are normalized by the initial gas column density Σg,0, the vertical scale height of the gas H, and the local orbital period P, respectively. In each case, the left and right panels are from models with a computational domain of 0.2H× 0.2H and 0.4H× 0.4H, respectively. The timespan for case (c) is 2.5 times that for cases (a) and (b).
Current usage metrics show cumulative count of Article Views (full-text article views including HTML views, PDF and ePub downloads, according to the available data) and Abstracts Views on Vision4Press platform.
Data correspond to usage on the plateform after 2015. The current usage metrics is available 48-96 hours after online publication and is updated daily on week days.
Initial download of the metrics may take a while.