Fig. 2
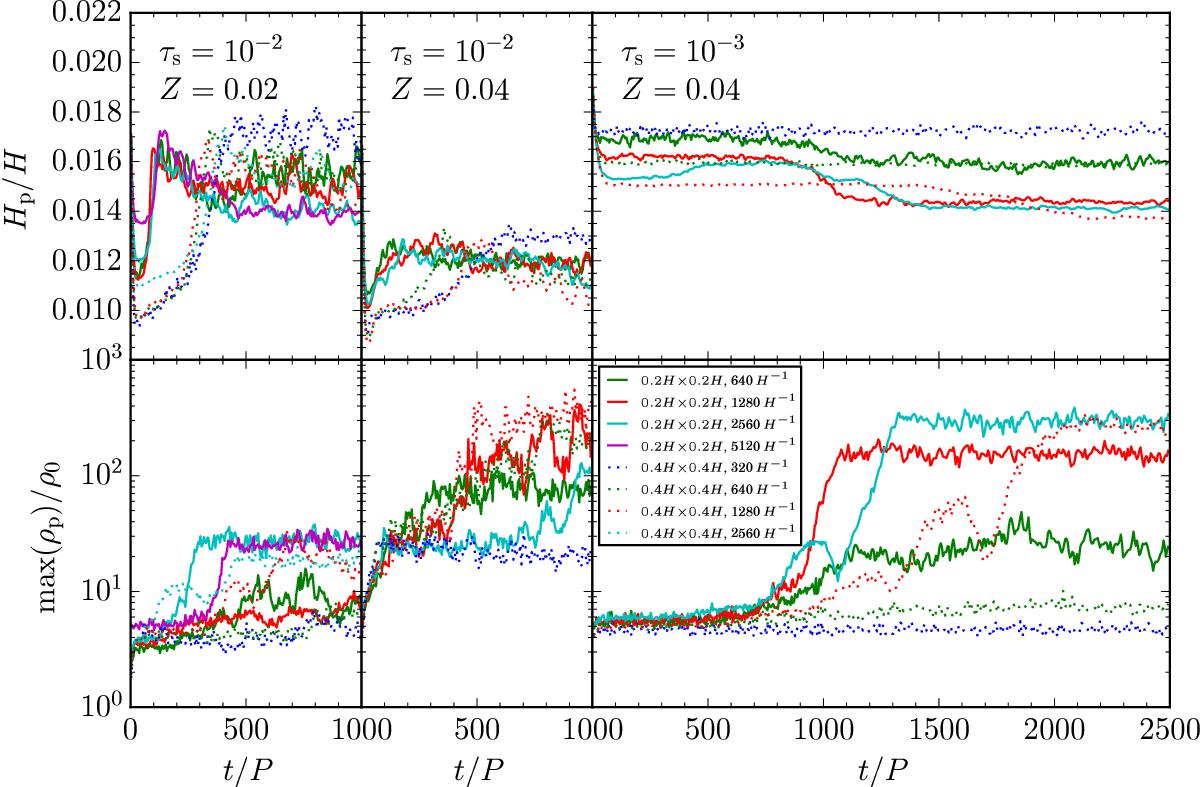
Scale height of the particle layer Hp (top panels) and maximum of the local particle density ρp (bottom panels) as a function of time for all our 2D models that trigger strong concentration of solids at high resolutions. Each column represents one set of dimensionless stopping time τs and solid abundance Z. The scale height Hp, particle density ρp, and time t are normalized by the vertical scale height of the gas H, the initial mid-plane gas density ρ0, and the local orbital period P, respectively. The solid and dotted lines are for a computational domain of 0.2H × 0.2H and 0.4H × 0.4H, respectively, and the resolutions are differentiated by different colors.
Current usage metrics show cumulative count of Article Views (full-text article views including HTML views, PDF and ePub downloads, according to the available data) and Abstracts Views on Vision4Press platform.
Data correspond to usage on the plateform after 2015. The current usage metrics is available 48-96 hours after online publication and is updated daily on week days.
Initial download of the metrics may take a while.