Fig. 6
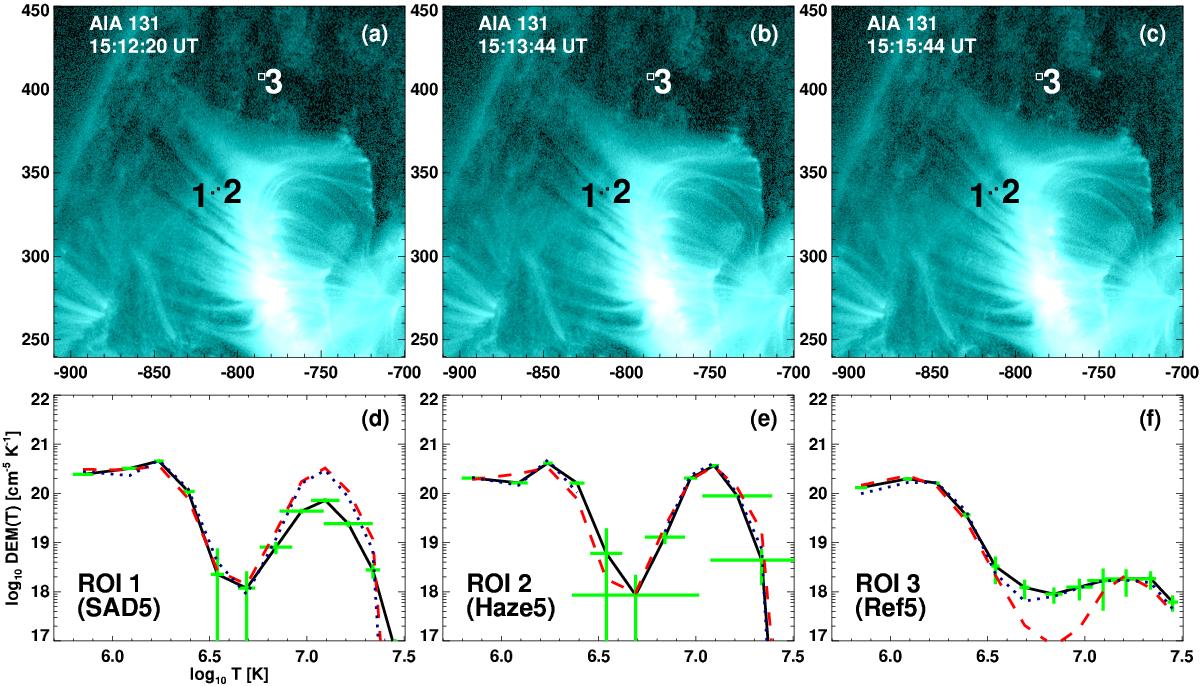
DEM analysis for a SAD appearing at around 15:13 UT on 2014 April 2. Panels a–c show snapshots of AIA 131 Å images before, during, and after the SAD has passed through ROI1. Panels d–f show DEM plots for RSAD5 (![]() ), Rhaze5 (
), Rhaze5 (![]() ), and Rref5 (
), and Rref5 (![]() ); the red dashed lines correspond to 15:12 UT (panel a); the black solid lines correspond to 15:13 UT (panel b) with green error bars; and the blue dotted lines correspond to 15:15 UT (panel c).
); the red dashed lines correspond to 15:12 UT (panel a); the black solid lines correspond to 15:13 UT (panel b) with green error bars; and the blue dotted lines correspond to 15:15 UT (panel c).
Current usage metrics show cumulative count of Article Views (full-text article views including HTML views, PDF and ePub downloads, according to the available data) and Abstracts Views on Vision4Press platform.
Data correspond to usage on the plateform after 2015. The current usage metrics is available 48-96 hours after online publication and is updated daily on week days.
Initial download of the metrics may take a while.