Fig. 9
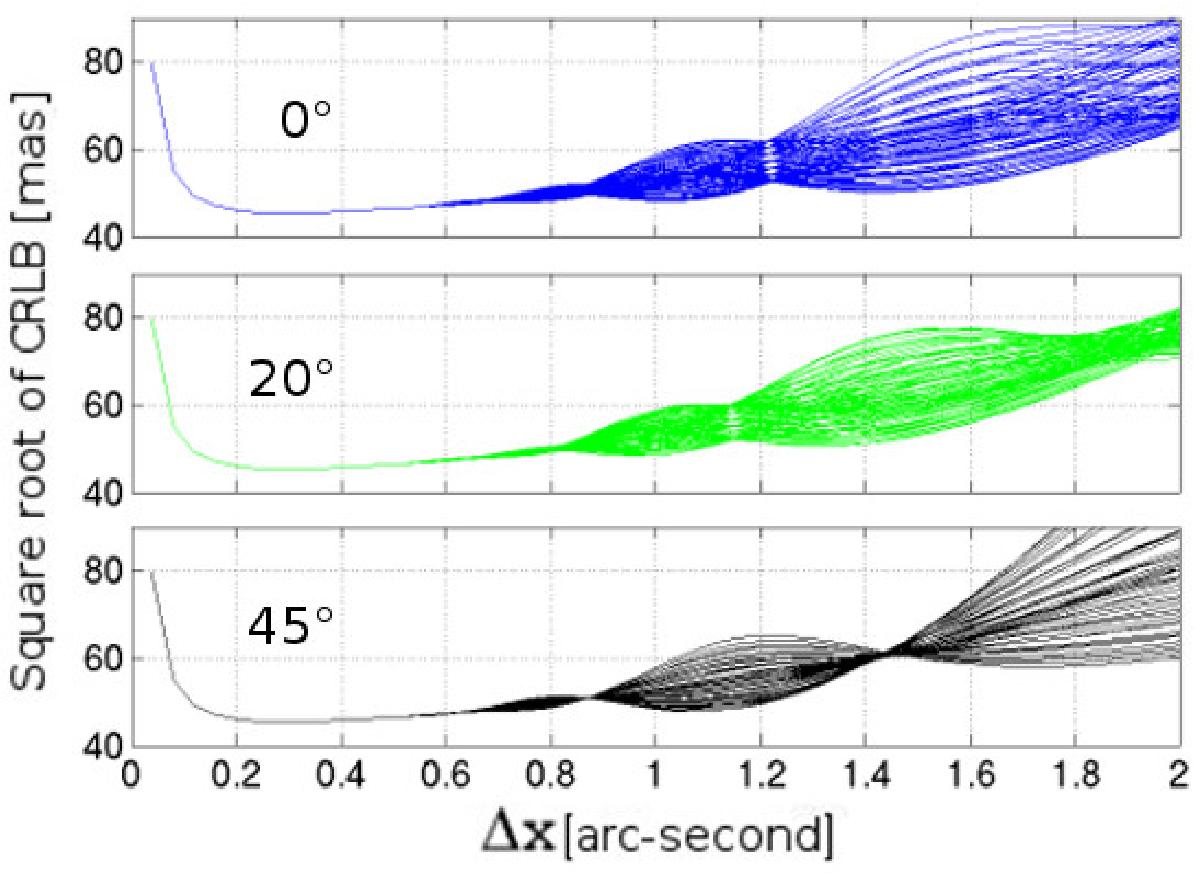
Square root of the CRLB in mas for a moving source observed with a two-dimensional array detector as a function of detector pixel size Δx in arcseconds. The figure is divided into three sub-figures, each one corresponding to a specific orientation of the source drift with respect of the detector-array frame. Within each sub-figure, each line corresponds to two different values of decentering along X and Y axis between − 0.46 and 0 pixel. The parameter values are L = 3.0′′, FWHM = 1.0′′, ![]() e−, D = 0e−/pix, RON = 5e−/pix, and b = 6000e−/arcsec2.
e−, D = 0e−/pix, RON = 5e−/pix, and b = 6000e−/arcsec2.
Current usage metrics show cumulative count of Article Views (full-text article views including HTML views, PDF and ePub downloads, according to the available data) and Abstracts Views on Vision4Press platform.
Data correspond to usage on the plateform after 2015. The current usage metrics is available 48-96 hours after online publication and is updated daily on week days.
Initial download of the metrics may take a while.