Fig. 8
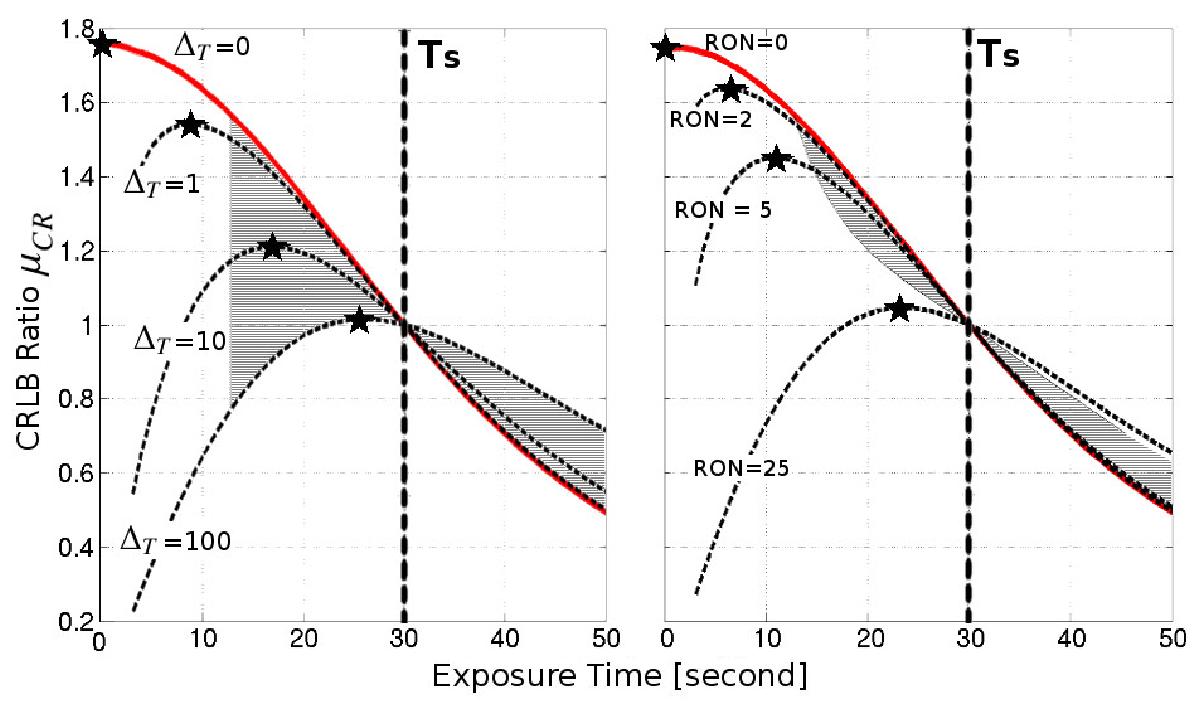
CRLB ratio versus exposure time for a moving source with Vx = 2′′/min, bs = 2000e−/arcsec/min, FWHM = 1.0′′, Δx = 0.3′′, d = 0, and fs = 800e−/min. The star symbols correspond to the maximum of each curve. The vertical dashed line is Ts, the exposure time corresponding to a drifting parameter equal to the FWHM (left: RON equals zero and ΔT equals 0, 1, 10, and 100 s; right: ΔT equals zero and RON equals 0, 2, 5, and 25e−/pix). The hatched areas correspond to exposure times long enough to allow source detection (here, the source is assumed to be detectable for a peak S/N higher than 3.5).
Current usage metrics show cumulative count of Article Views (full-text article views including HTML views, PDF and ePub downloads, according to the available data) and Abstracts Views on Vision4Press platform.
Data correspond to usage on the plateform after 2015. The current usage metrics is available 48-96 hours after online publication and is updated daily on week days.
Initial download of the metrics may take a while.