Fig. 6
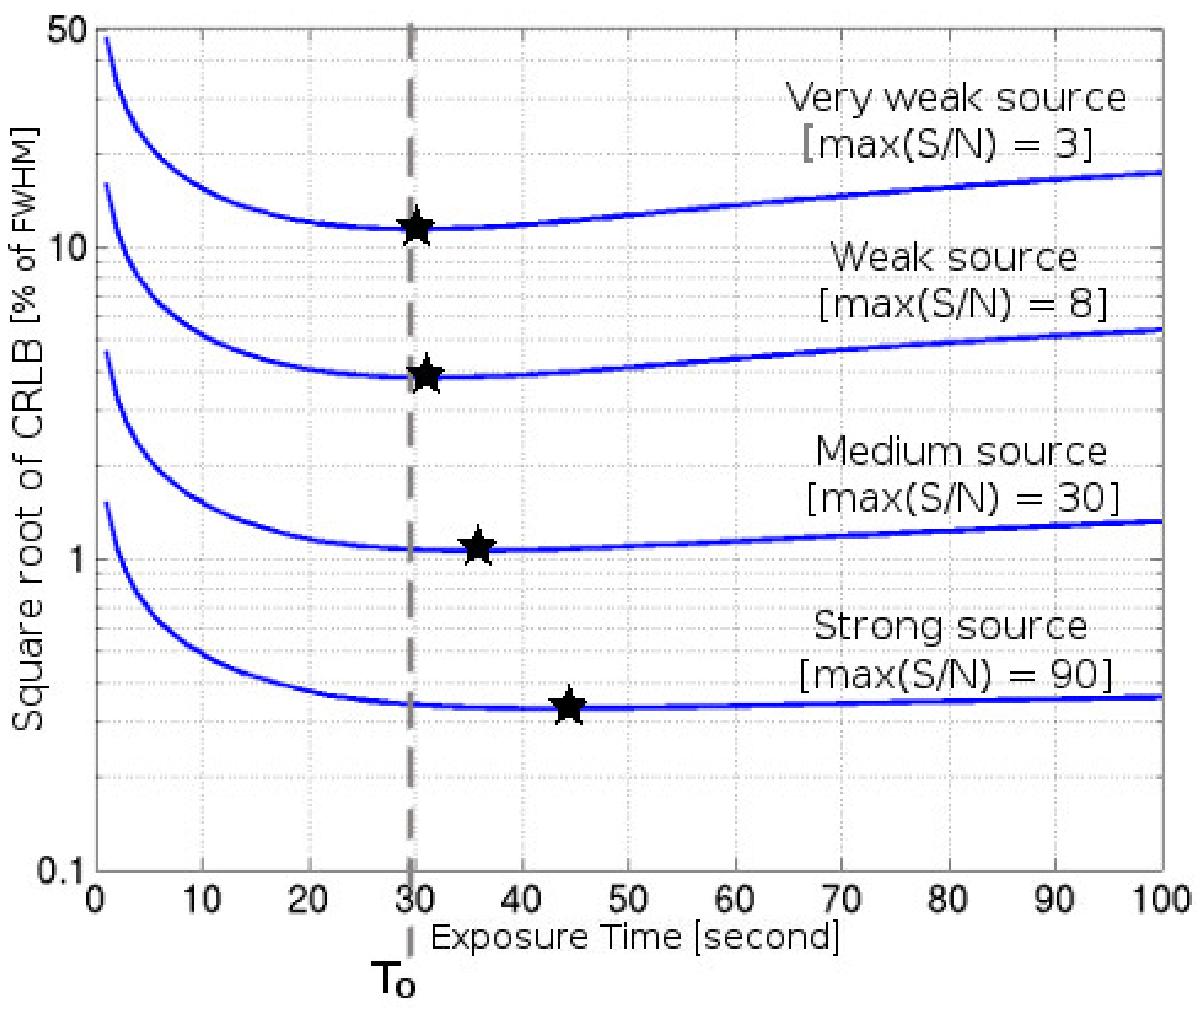
Square root of the CRLB versus exposure time for sources with a speed of 2′′/min and for which the fluxes per minute fsfrom top to bottom of the figure are 600, 2000, 10 000, and 60 000e−/min (FWHM = 1.0′′, Δx = 0.3′′, bs = 2000e−/arcsec/min, d = 0, and RON = 0), respectively. The star symbols correspond to the optimum exposure time for each source. The vertical dashed line is the lower limit TO of the optimum exposure time when the flux is completely dominated by the sky background.
Current usage metrics show cumulative count of Article Views (full-text article views including HTML views, PDF and ePub downloads, according to the available data) and Abstracts Views on Vision4Press platform.
Data correspond to usage on the plateform after 2015. The current usage metrics is available 48-96 hours after online publication and is updated daily on week days.
Initial download of the metrics may take a while.