Free Access
Fig. 5
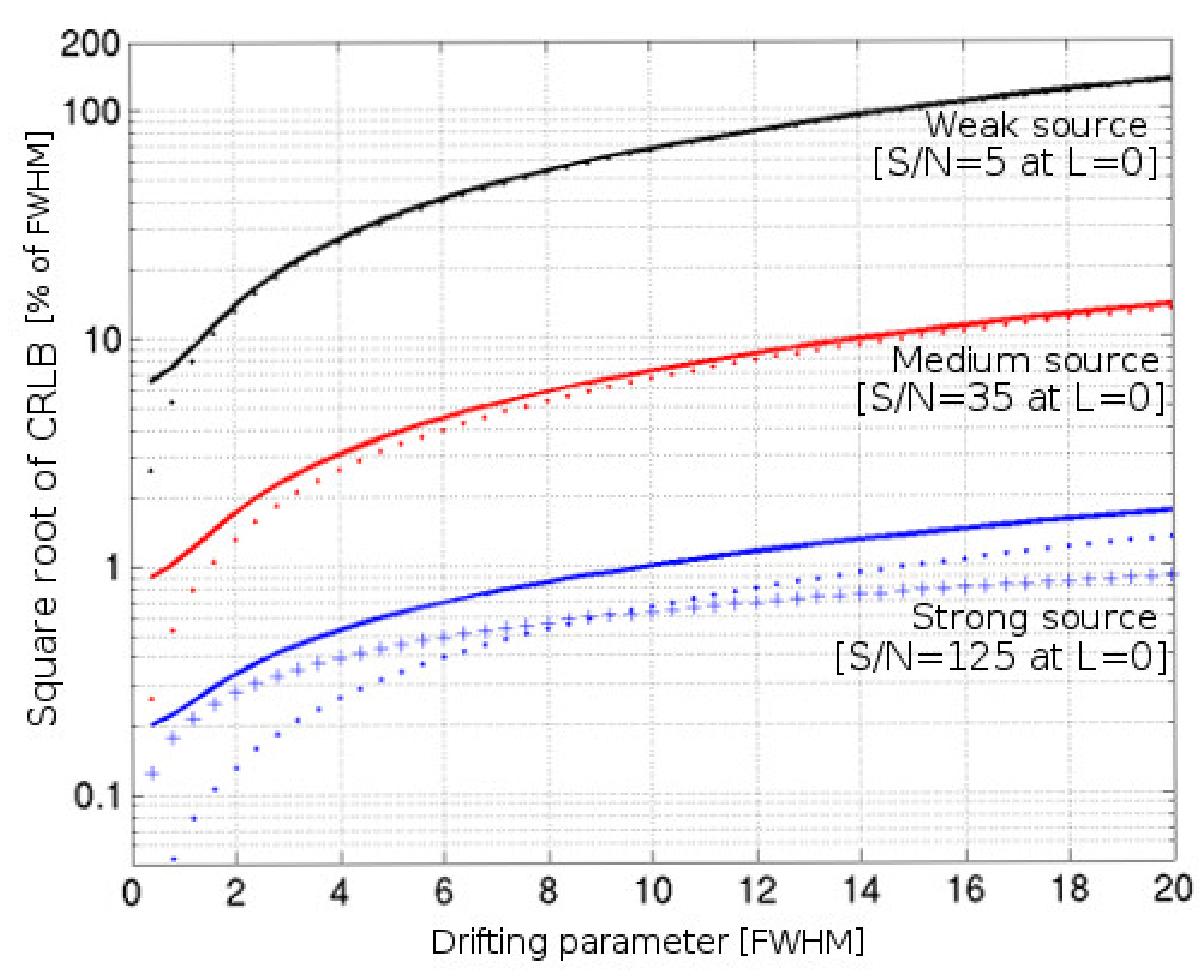
Solid lines of this figure are similar to those of Fig. 4, but for a larger drifting parameter. The lines with dots correspond to the same curves as the solid lines, but the CRLB for them has been approximated by Eq. (14). The line with aplussign corresponds to the CRLB approximated by Eq. (15) for the strongest source.
Current usage metrics show cumulative count of Article Views (full-text article views including HTML views, PDF and ePub downloads, according to the available data) and Abstracts Views on Vision4Press platform.
Data correspond to usage on the plateform after 2015. The current usage metrics is available 48-96 hours after online publication and is updated daily on week days.
Initial download of the metrics may take a while.