Fig. 4
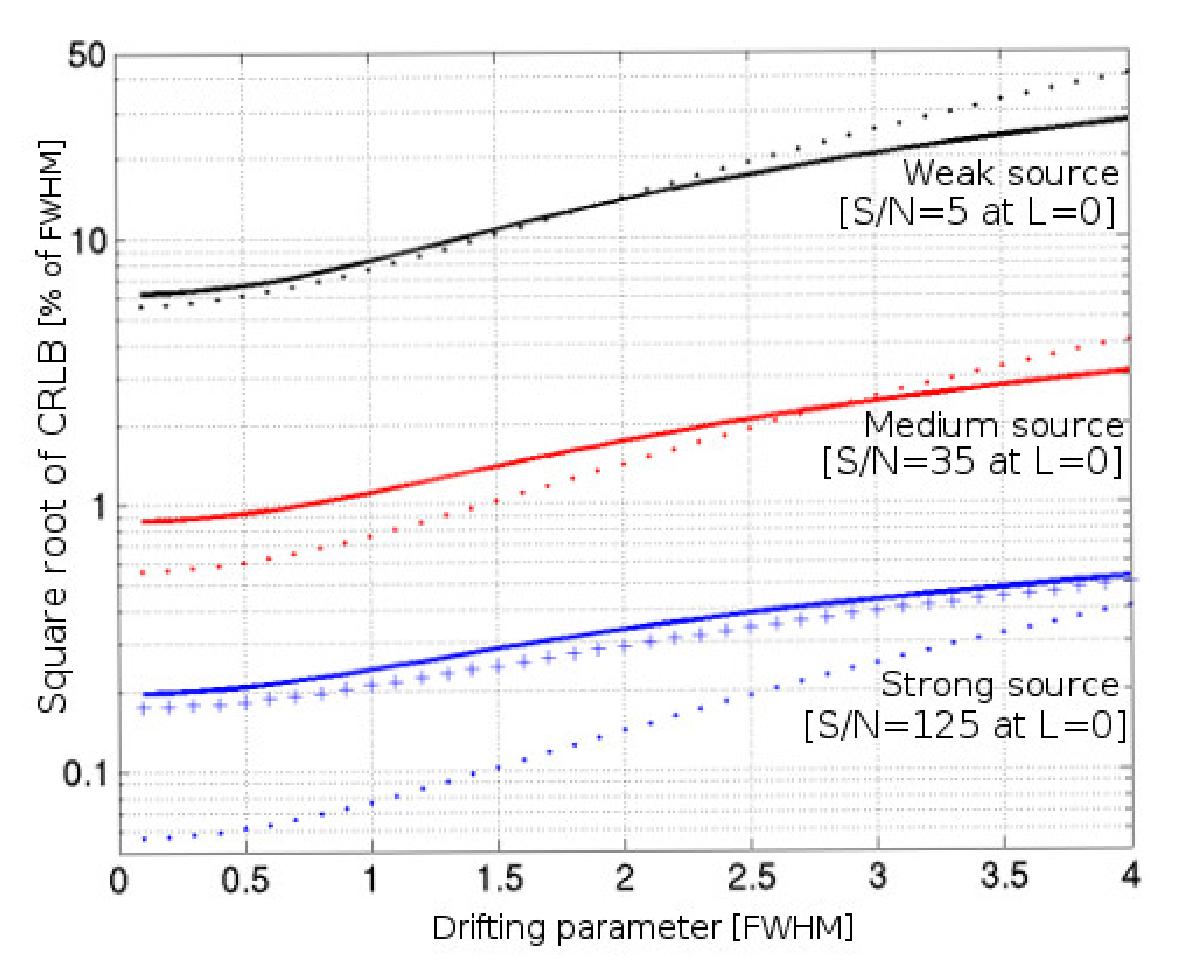
Square root of the CRLB (in percentage of the FWHM) versus the drifting parameter of the source (in FWHM) for a detector pixel size of 0.3′′ and FWHM = 1.0′′ (the background is given by Eq. (9) with b = 2000 e−/ arcsec, D = 0 and RON = 5e−). The three solid lines correspond to the exact CRLB given by Eq. (8) from bottom to top for a strong source (![]() e−), a medium source (
e−), a medium source (![]() e− ), and a weak source (
e− ), and a weak source (![]() e−), respectively. The three dotted lines from bottom to top correspond to the same sources, but with the CRLB computed with the approximate expression (12). The line with aplussign corresponds to the CRLB computed with the approximate Eq. (13) for the strong source. The indicated S/N is measured at peak value.
e−), respectively. The three dotted lines from bottom to top correspond to the same sources, but with the CRLB computed with the approximate expression (12). The line with aplussign corresponds to the CRLB computed with the approximate Eq. (13) for the strong source. The indicated S/N is measured at peak value.
Current usage metrics show cumulative count of Article Views (full-text article views including HTML views, PDF and ePub downloads, according to the available data) and Abstracts Views on Vision4Press platform.
Data correspond to usage on the plateform after 2015. The current usage metrics is available 48-96 hours after online publication and is updated daily on week days.
Initial download of the metrics may take a while.