Fig. 2
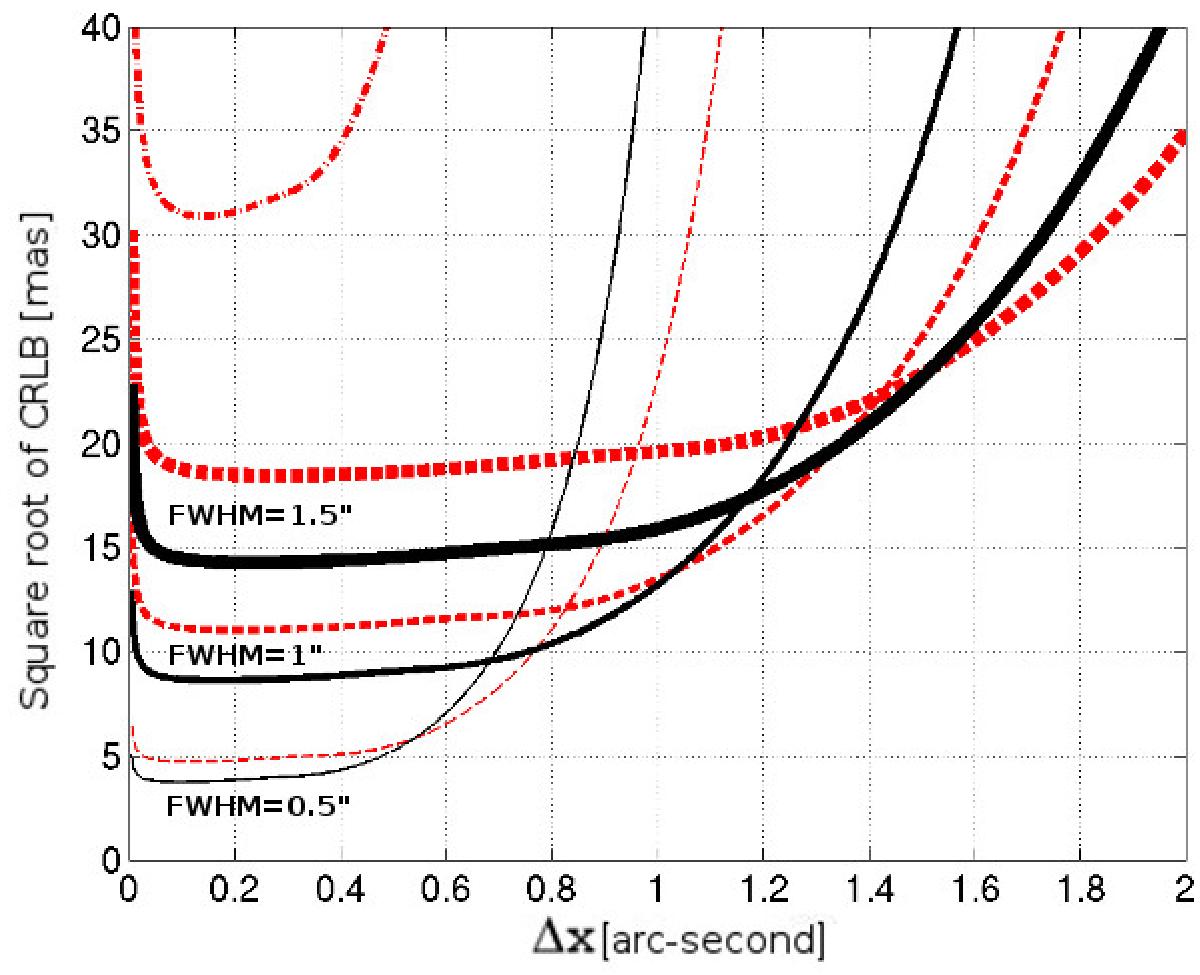
Square root of the CRLB in mas as a function of detector pixel size Δx in arcseconds when the background flux per pixel is given by Eq. (9) with b = 2000e−/arcsec, D is zero, and RON = 5 e−. The solid lines (thin, normal, and bold) are for the PSF of a non-moving Gaussian source with F = 6000e− and an image quality with an FWHM of 0.5, 1.0, and 1.5′′, respectively (all centered on a given pixel). The dashed lines correspond to the same curves computed for a slow-moving source with a drifting parameter equal to the FWHM that was used to compute each line. The upper dash-dotted line is similar to the lower dashed line (FWHM = 0.5′′), but for a source ten times fainter (F = 600e−).
Current usage metrics show cumulative count of Article Views (full-text article views including HTML views, PDF and ePub downloads, according to the available data) and Abstracts Views on Vision4Press platform.
Data correspond to usage on the plateform after 2015. The current usage metrics is available 48-96 hours after online publication and is updated daily on week days.
Initial download of the metrics may take a while.