Fig. 15
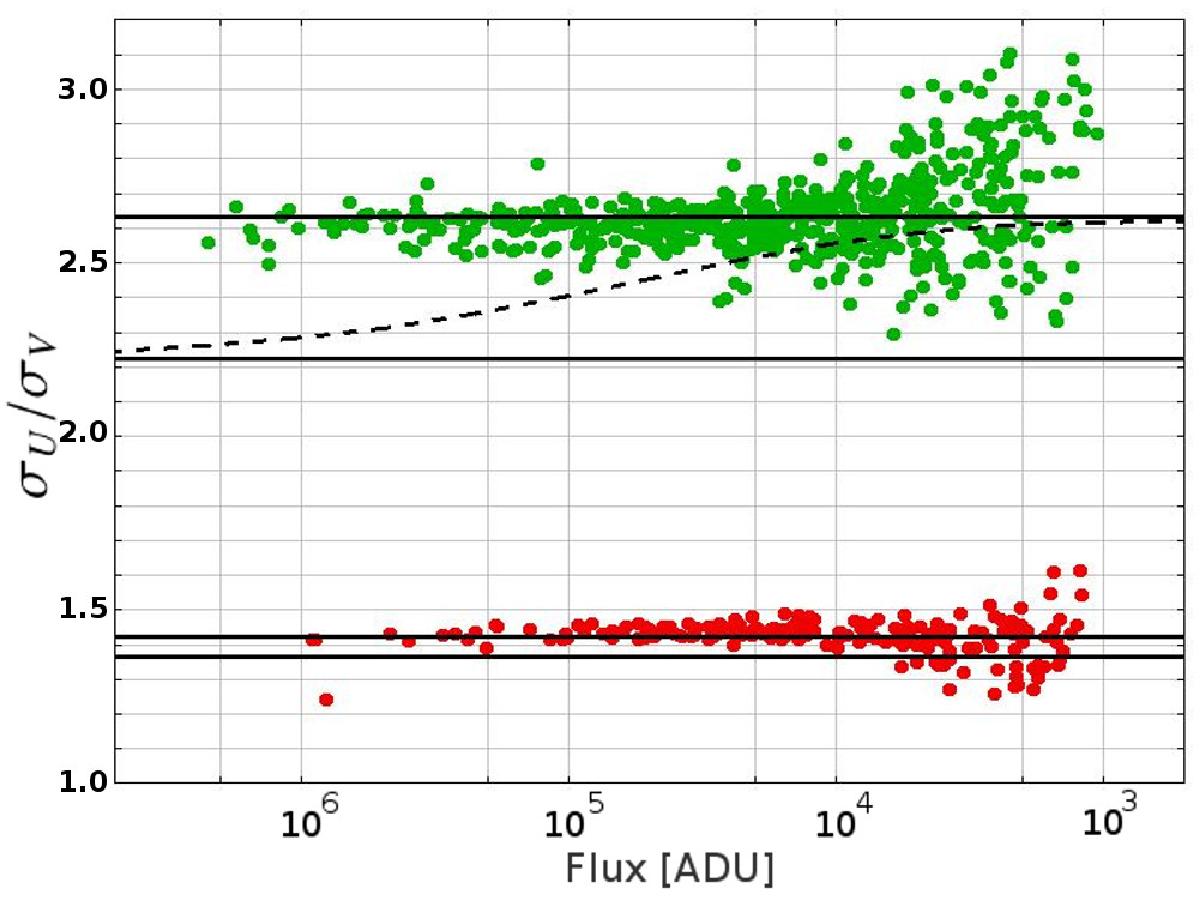
σU to σV ratio versus flux (in ADU). The circles are for the stars in the VST images: upper circles are for stars in the image VSTF, while lower circles are for the stars in VSTS (see text). The dashed curve corresponds to the ratio of the two exact expressions of the CRLB, Eqs. (30) and (36), with the parameters corresponding to the image VSTF. The two upper horizontal lines correspond to the approximations of this ratio for the image VSTF in the case of fast-moving sources (expression (41) for faint sources and expression (42) for bright sources). The two lower horizontal lines correspond to the approximations of this ratio for the image VSTS in the case of slow-moving sources (expression (43) for faint sources and expression (44) for bright sources).
Current usage metrics show cumulative count of Article Views (full-text article views including HTML views, PDF and ePub downloads, according to the available data) and Abstracts Views on Vision4Press platform.
Data correspond to usage on the plateform after 2015. The current usage metrics is available 48-96 hours after online publication and is updated daily on week days.
Initial download of the metrics may take a while.