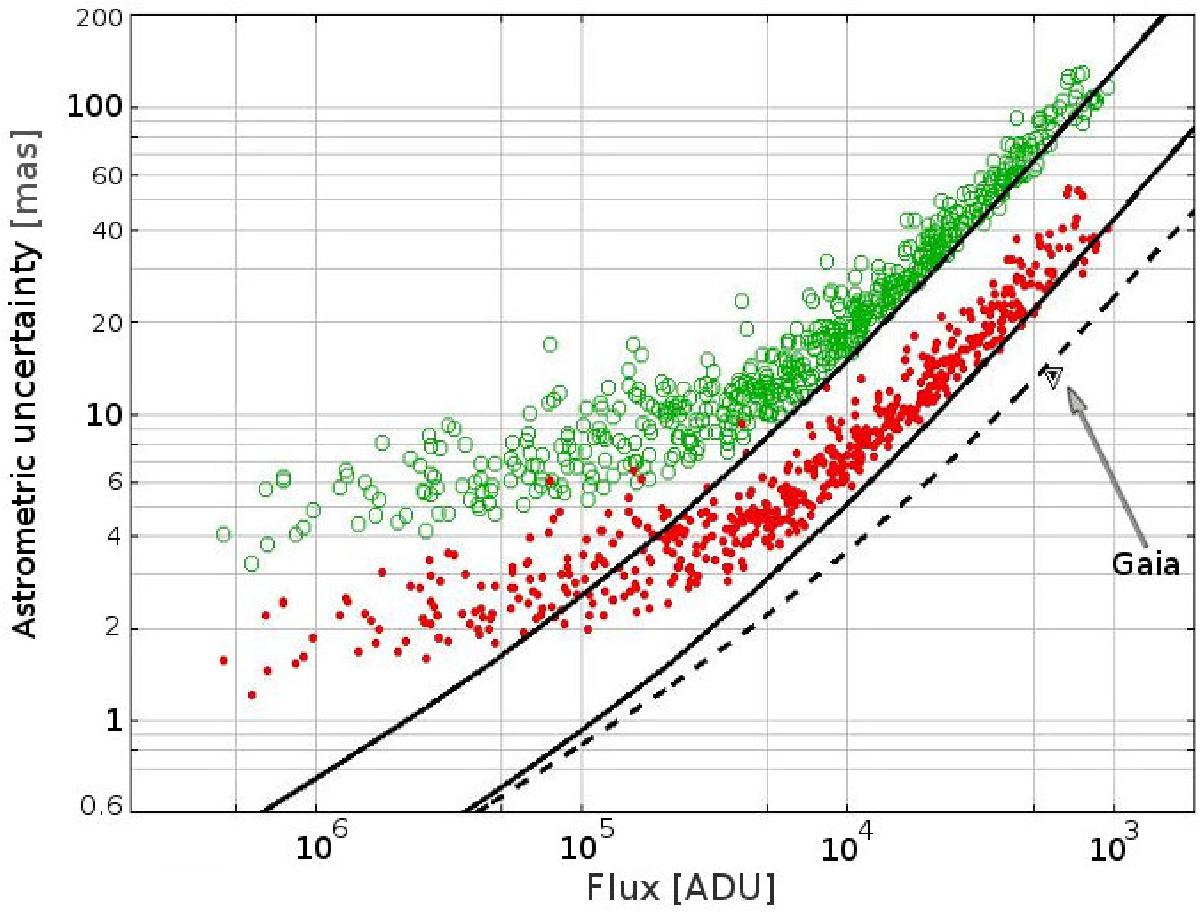
Fig. 14

Astrometric uncertainty estimates for the photocenters of stars (and Gaia) as measured by the GBOT reduction pipeline on the VST image as a function of flux (in ADU). The open and filled circles are the uncertainty estimates along the U and the V directions, respectively (the open and filled diamonds are for Gaia). The dashed curves correspond to the corresponding CRLB values for stationary sources, while the solid curves are the CRLB values for moving sources. The CRLB has been estimated with the expressions developed for two-dimensional array detectors (Eq. (27) for stationary sources and Eqs. (30) and (36) for moving sources for the CRLB along the U and V directions, respectively).
Current usage metrics show cumulative count of Article Views (full-text article views including HTML views, PDF and ePub downloads, according to the available data) and Abstracts Views on Vision4Press platform.
Data correspond to usage on the plateform after 2015. The current usage metrics is available 48-96 hours after online publication and is updated daily on week days.
Initial download of the metrics may take a while.


