Fig. 12
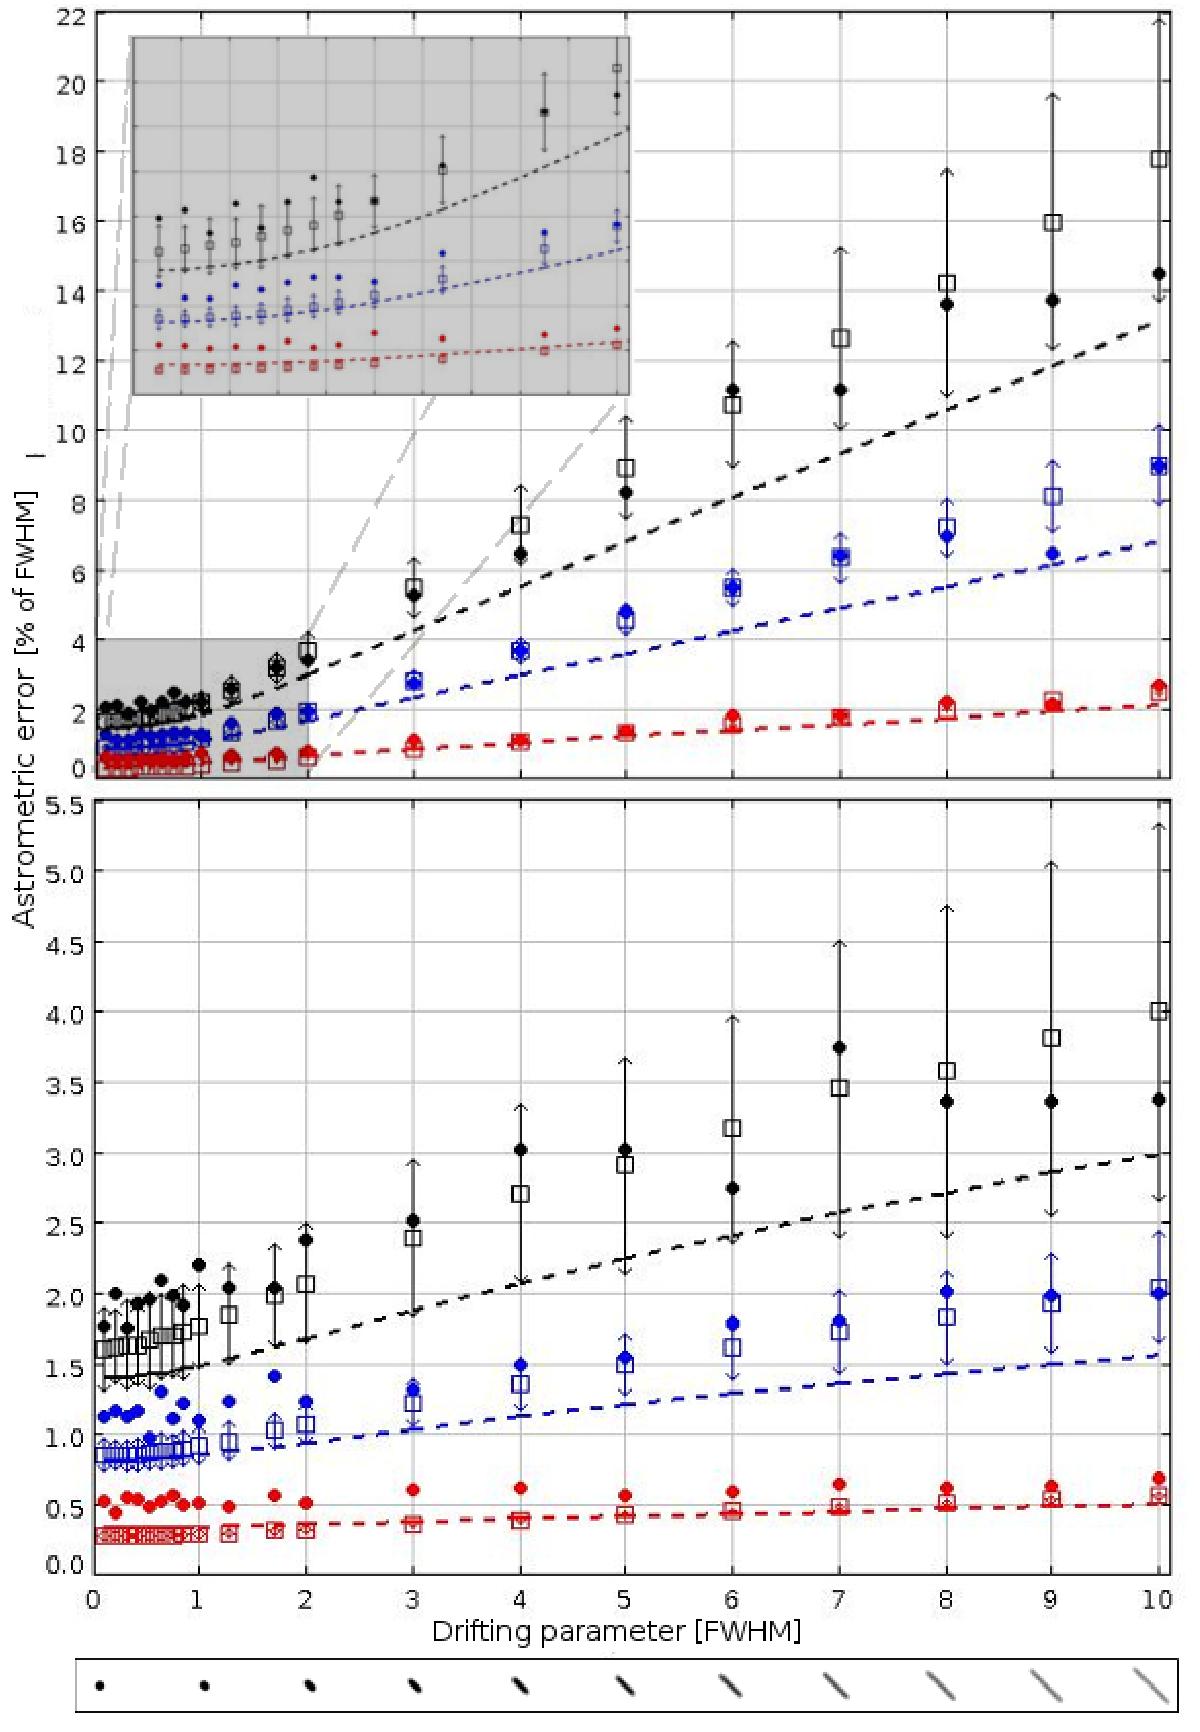
True astrometric errors, their GBOT estimates, and the corresponding CRLB values for different values of the source-drifting parameter between zero and tentimesthe FWHM (along the U-axis in the top panel, and along the V-axis in the bottom panel). Each filled circle is the standard deviation of the “true astrometric errors” of one simulated image. Each open square and related error bar are the mean value and standard deviation of the GBOT estimates of the astrometric uncertainties. The dashed curves are the corresponding value of the CRLB computed with Eqs. (30) and (36) for the top and bottom panels, respectively. The lower curves are for bright sources of set S1, the medium curves for sources of set S2, and the upper curves for faint sources of set S3 (see the details concerning the characteristics of each set in the text).
Current usage metrics show cumulative count of Article Views (full-text article views including HTML views, PDF and ePub downloads, according to the available data) and Abstracts Views on Vision4Press platform.
Data correspond to usage on the plateform after 2015. The current usage metrics is available 48-96 hours after online publication and is updated daily on week days.
Initial download of the metrics may take a while.