Fig. 10
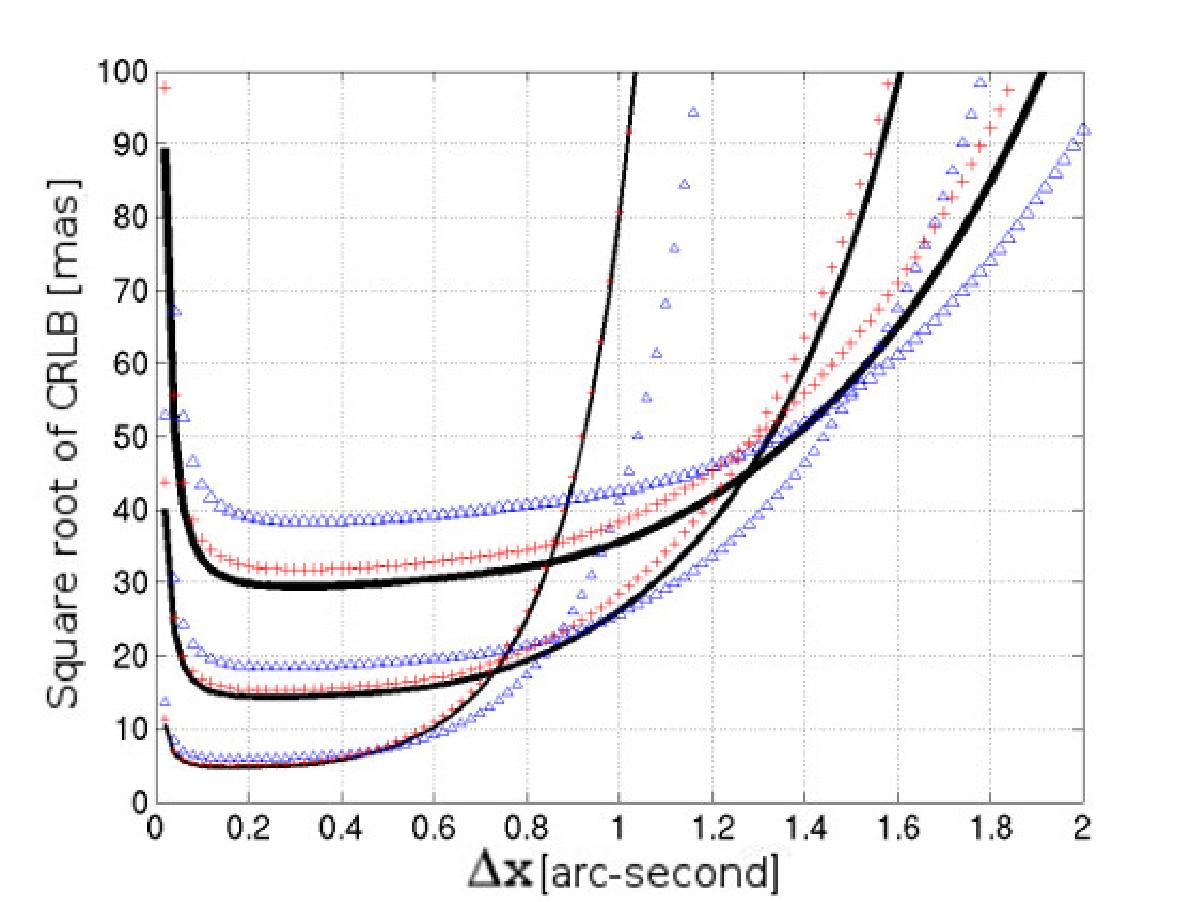
Square root of the CRLB in mas as a function of pixel size Δx for sources observed with a two-dimensional array detector when the background flux per pixel is given by Eq. (24) (b = 6000e−/arcsec2, D = 0 e−, RON = 5 e−, and F = 6000e−). The solid lines (thin, normal, and bold) are computed with expression (27) for a stationary source with an image quality FWHM of 0.5, 1.0, and 1.5′′, respectively (and all centered on a given pixel). The lines with a plus and with triangles correspond to the same curves, but in the moving case when the drifting parameter is optimum (L = Lo). The lines with a plus and with triangles correspond to the CRLB along the direction normal and parallel to the drifting motion, respectively.
Current usage metrics show cumulative count of Article Views (full-text article views including HTML views, PDF and ePub downloads, according to the available data) and Abstracts Views on Vision4Press platform.
Data correspond to usage on the plateform after 2015. The current usage metrics is available 48-96 hours after online publication and is updated daily on week days.
Initial download of the metrics may take a while.