Fig. A.1
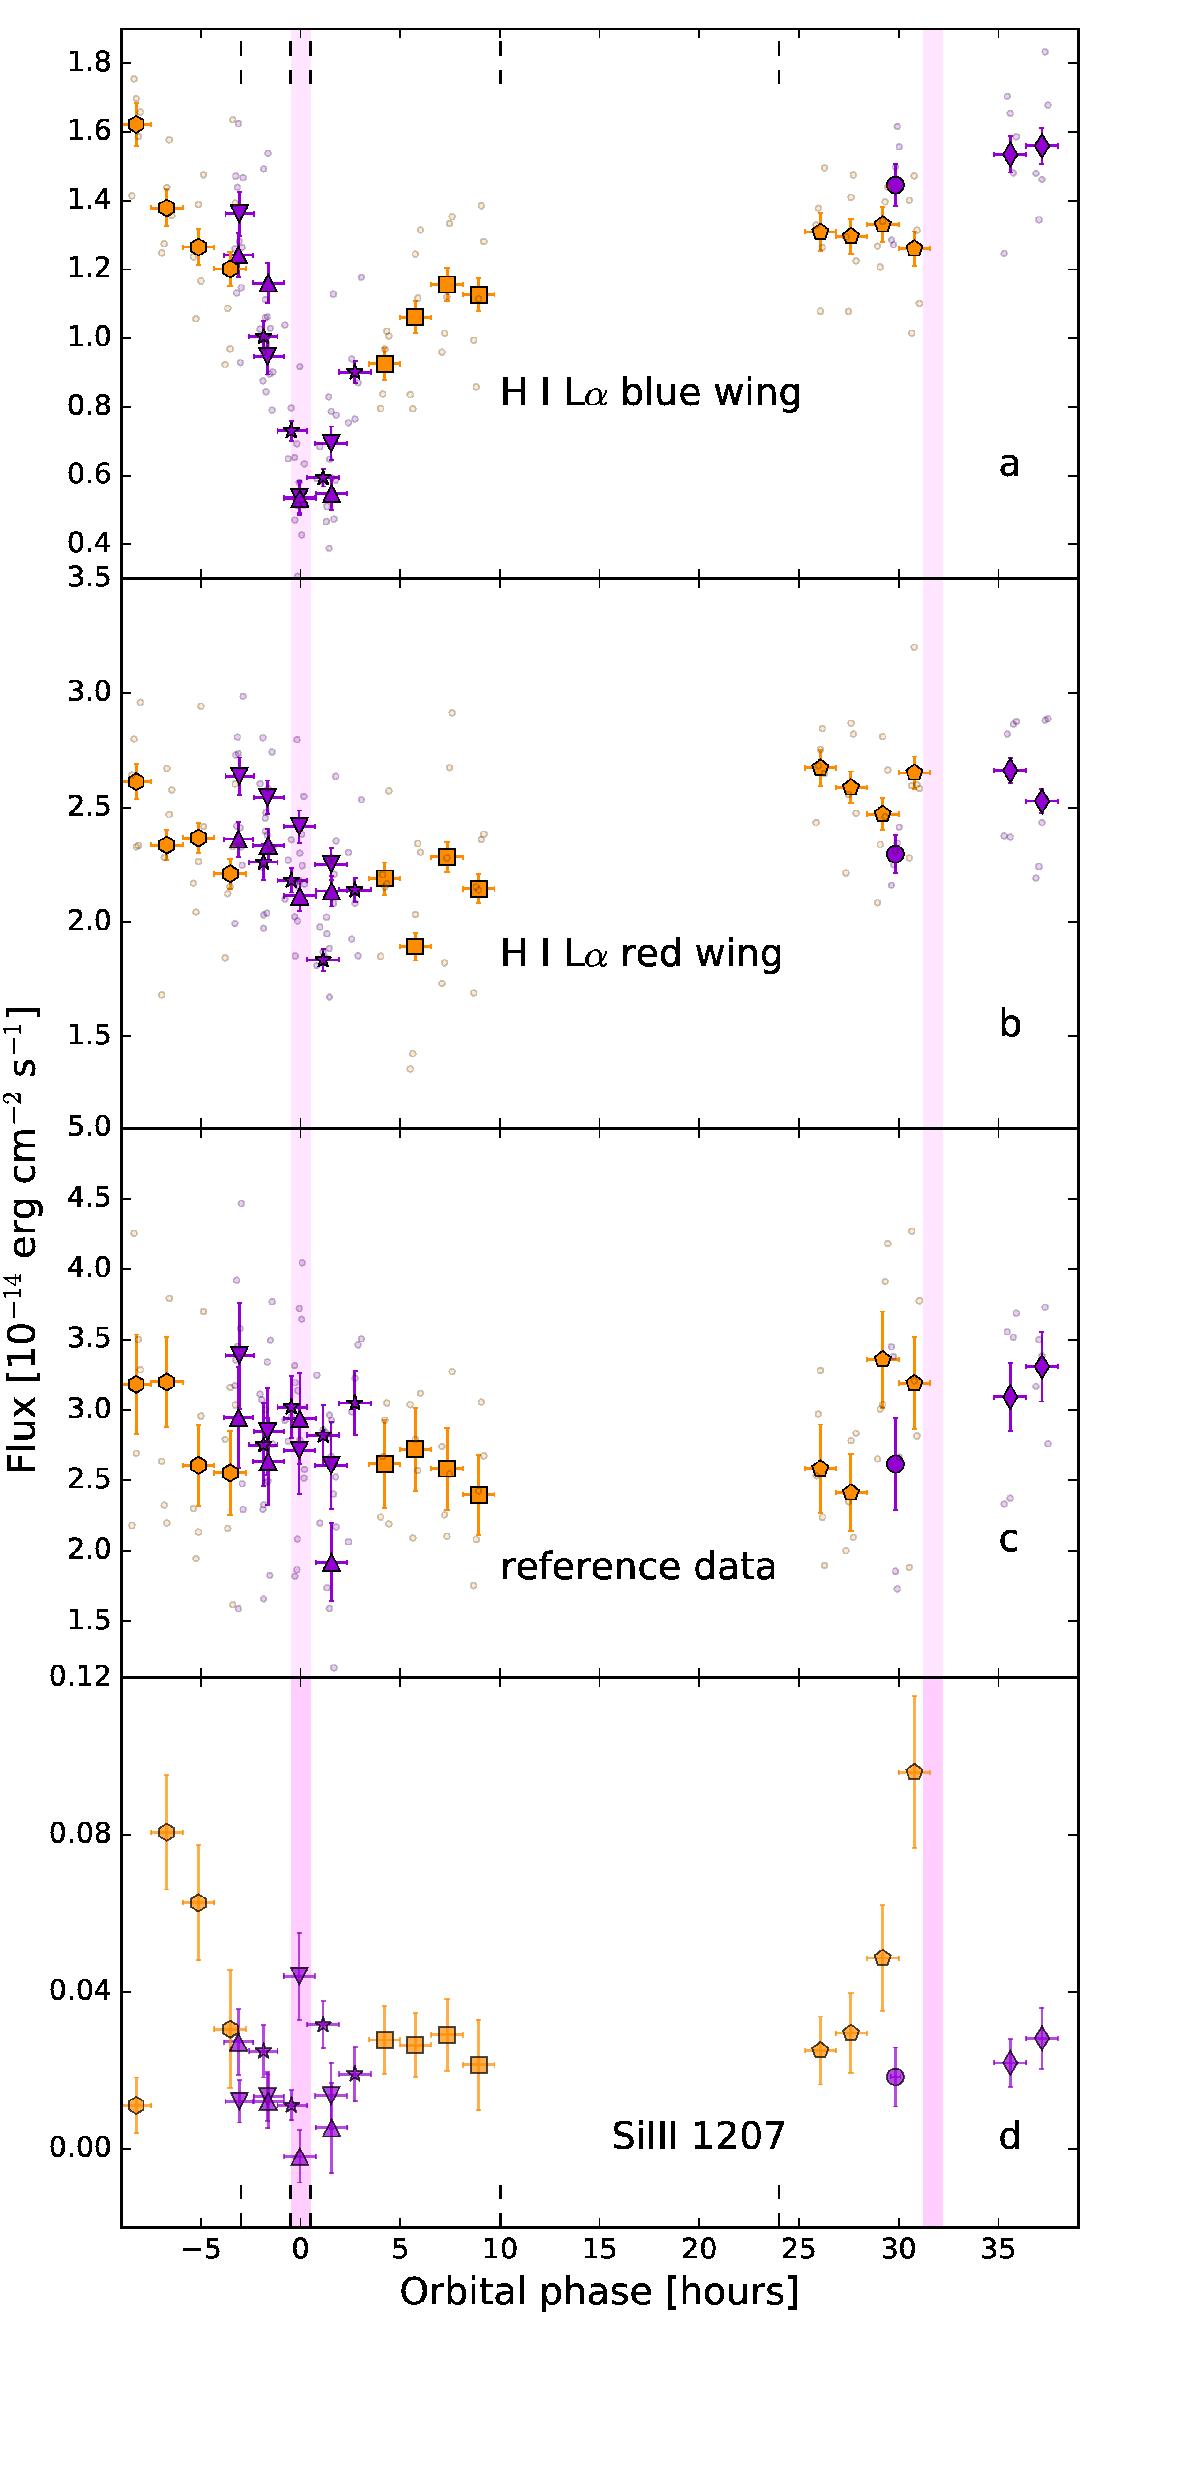
Lyα light curve of GJ 436 obtained from integrating the raw spectra uncorrected for systematics. The flux is integrated over the blue wing [− 120,−40] km s-1 (a), the red wing [+ 30, + 120] km s-1 (b), the reference band [− 250,−120] ∪ [ + 120, + 250] km s-1 (c), and the [− 50,50] km s-1 band of the Si iii line (d). The colour code is the same as in Fig. 1. Large coloured symbols with errors bars are the individual HST orbits (see Table A.1 for the visit symbols) while small grey circles are the time-tagged sub-exposures extracted from each HST orbit for panel a, b, and c.
Current usage metrics show cumulative count of Article Views (full-text article views including HTML views, PDF and ePub downloads, according to the available data) and Abstracts Views on Vision4Press platform.
Data correspond to usage on the plateform after 2015. The current usage metrics is available 48-96 hours after online publication and is updated daily on week days.
Initial download of the metrics may take a while.