Fig. 1
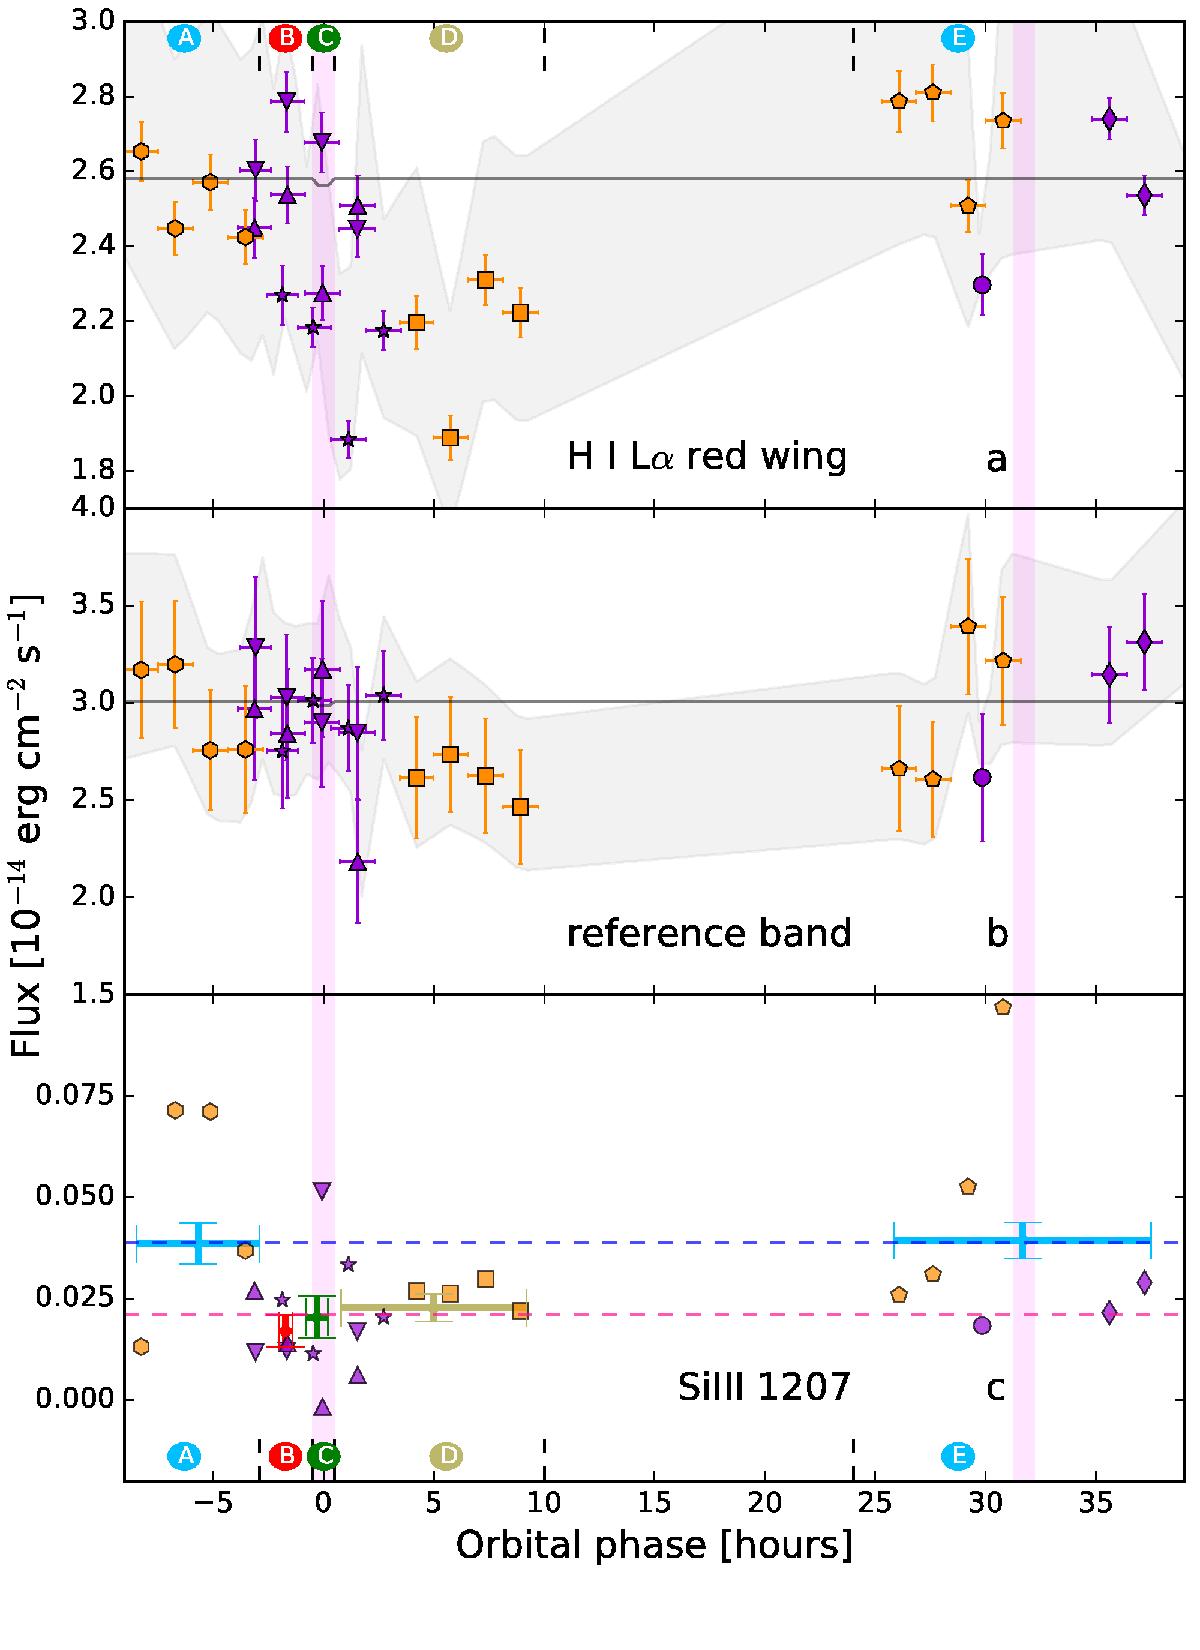
Light curves of GJ 436 integrated Lyα red wing (a), Lyα reference band [− 250,−120] ∪ [ + 120, + 250] km s-1 (b) and Si iii line (c). New visits described in this work are in orange while previous visits are plotted in violet. Symbols are in Table A.1. Different temporal regions are defined: (A) before transit, (B) ingress, (C) optical transit, (D) egress, and (E) after transit. The grey-filled region represents the 1σ confidence interval of the systematic correction method using the Gaussian processes (Appendix B). The vertical magenta zones show the optical primary and secondary transit. The optical transit light curve of GJ 436b is indicated with the black line. In panel c, fluxes are integrated for the different temporal region (see Fig. 2). Horizontal dashed lines indicate the out-of-transit flux (blue – regions A and E) and the in-transit flux (pink – regions B, C, and D).
Current usage metrics show cumulative count of Article Views (full-text article views including HTML views, PDF and ePub downloads, according to the available data) and Abstracts Views on Vision4Press platform.
Data correspond to usage on the plateform after 2015. The current usage metrics is available 48-96 hours after online publication and is updated daily on week days.
Initial download of the metrics may take a while.