Fig. 5
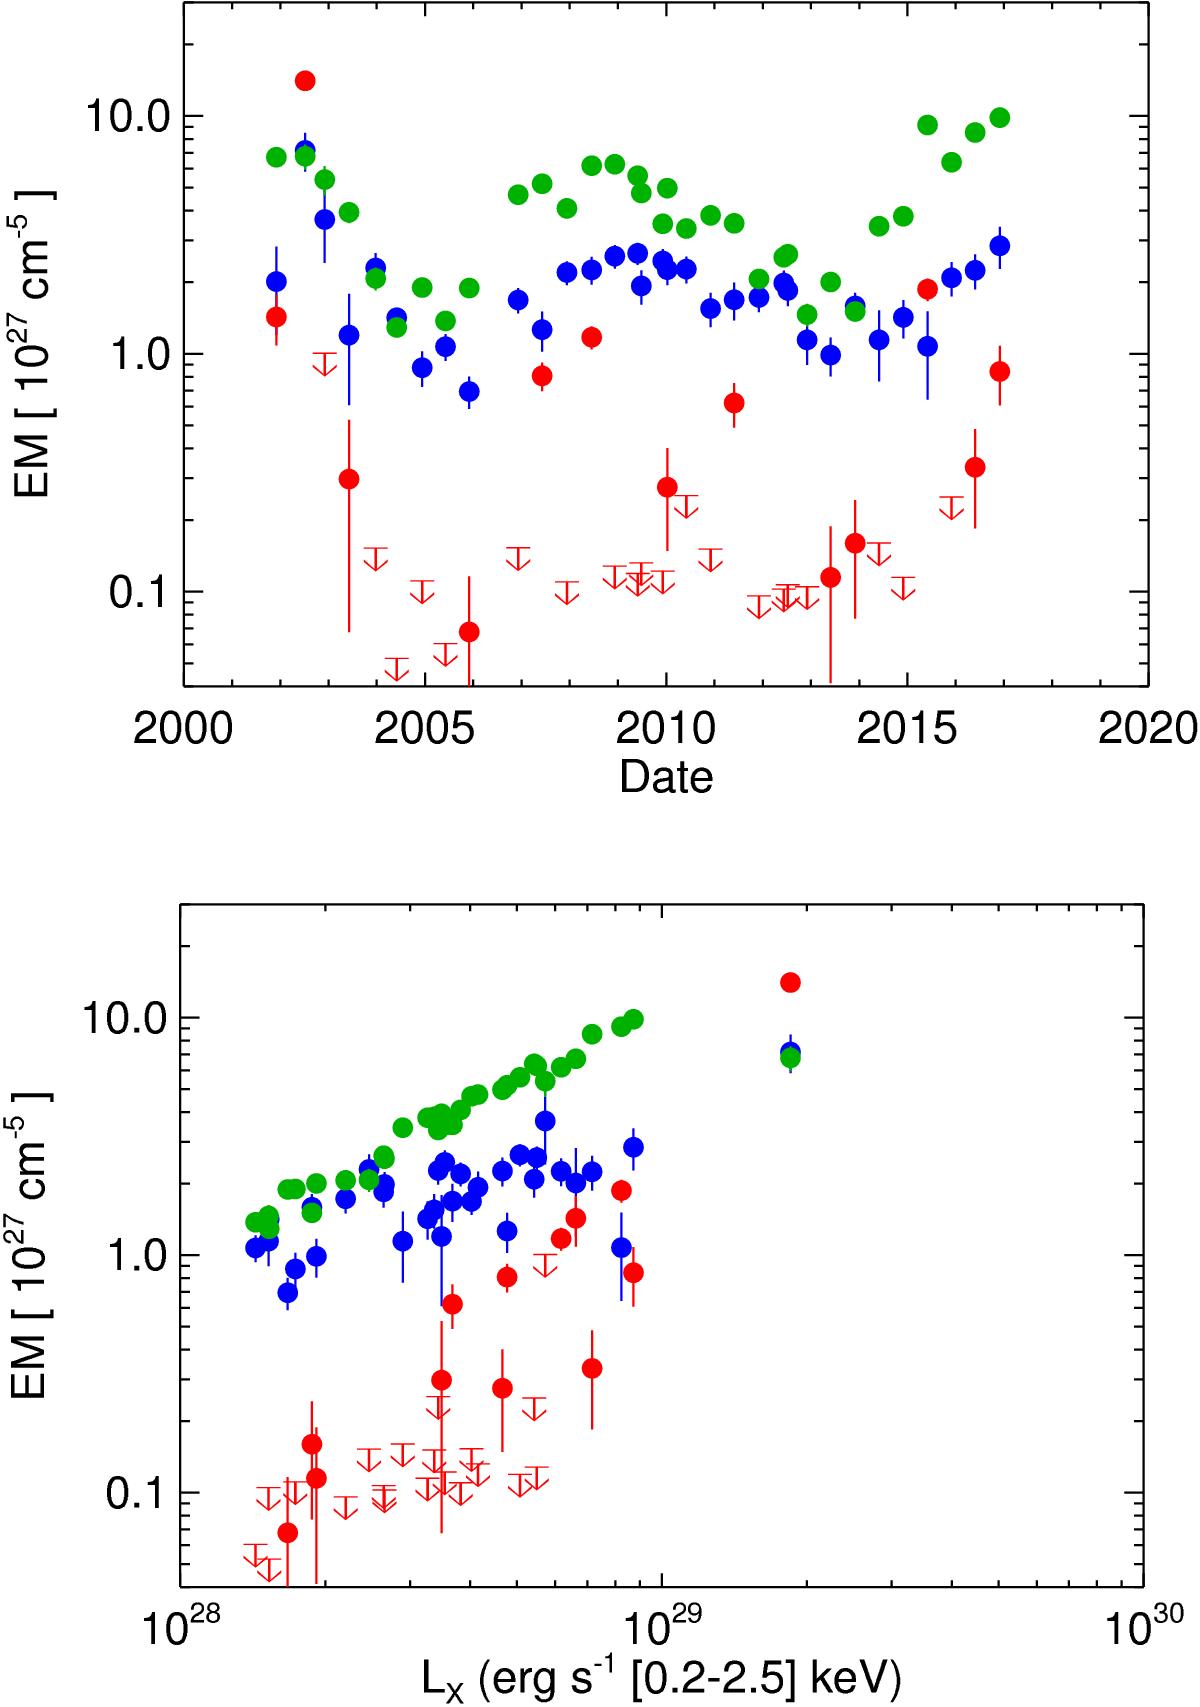
Best-fit emission measures from the three-temperatures model along the coronal cycle of HD 81809 (upper panel) and as a function of coronal luminosity (lower panel). The figure shows the parameters for the coldest (blue circles, corresponding to active regions), intermediate (green, corresponding to cores), and hottest (red, corresponding to flares) components. Upper limits are indicated with arrows.

Current usage metrics show cumulative count of Article Views (full-text article views including HTML views, PDF and ePub downloads, according to the available data) and Abstracts Views on Vision4Press platform.
Data correspond to usage on the plateform after 2015. The current usage metrics is available 48-96 hours after online publication and is updated daily on week days.
Initial download of the metrics may take a while.