Fig. 3
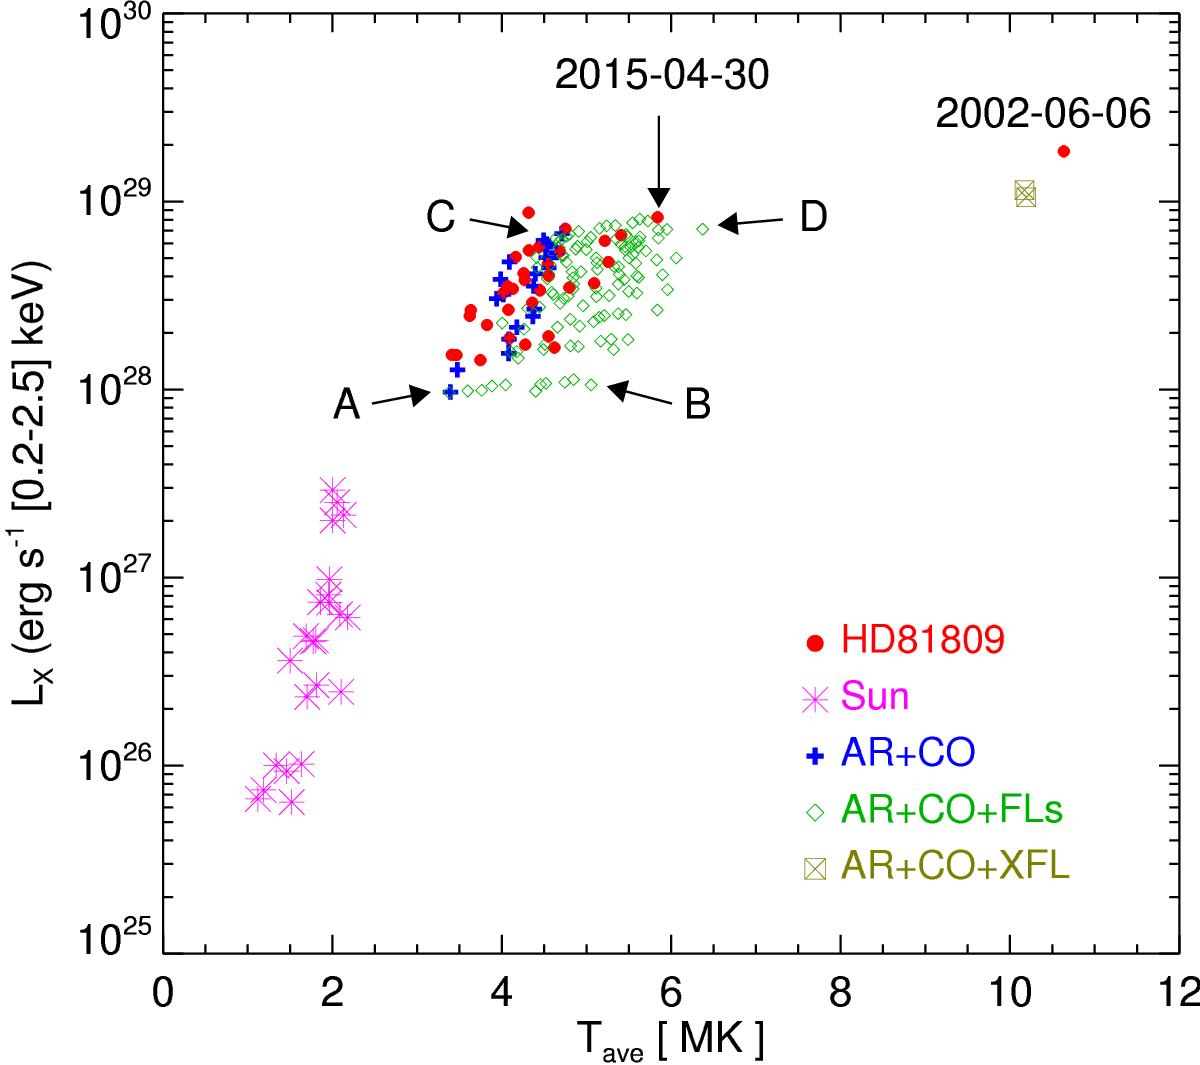
Evolution of coronal X-ray temperature and luminosity along the cycle for the Sun (magenta stars; data adapted from Orlando et al. 2001) and HD 81809 (red filled circles). The figure also reports the simulated data obtained assuming a mixture of solar-like coronal regions: active regions and cores (namely non-flaring regions; AR+CO, blue crosses), and active regions, cores, and flares (AR+CO+FLs, green diamonds). The crossed square (AR+CO+XFL) indicates the synthetic values considering the contribution of a very intense flare (GOES class X9) to the non-flaring corona with maximum coverage of cores (~ 40%). Labels A–D denote the simulated data points corresponding to the EM(T) distributions in Fig. 2. The data from actual spectra of June 2002 and April 2015 are indicated.
Current usage metrics show cumulative count of Article Views (full-text article views including HTML views, PDF and ePub downloads, according to the available data) and Abstracts Views on Vision4Press platform.
Data correspond to usage on the plateform after 2015. The current usage metrics is available 48-96 hours after online publication and is updated daily on week days.
Initial download of the metrics may take a while.