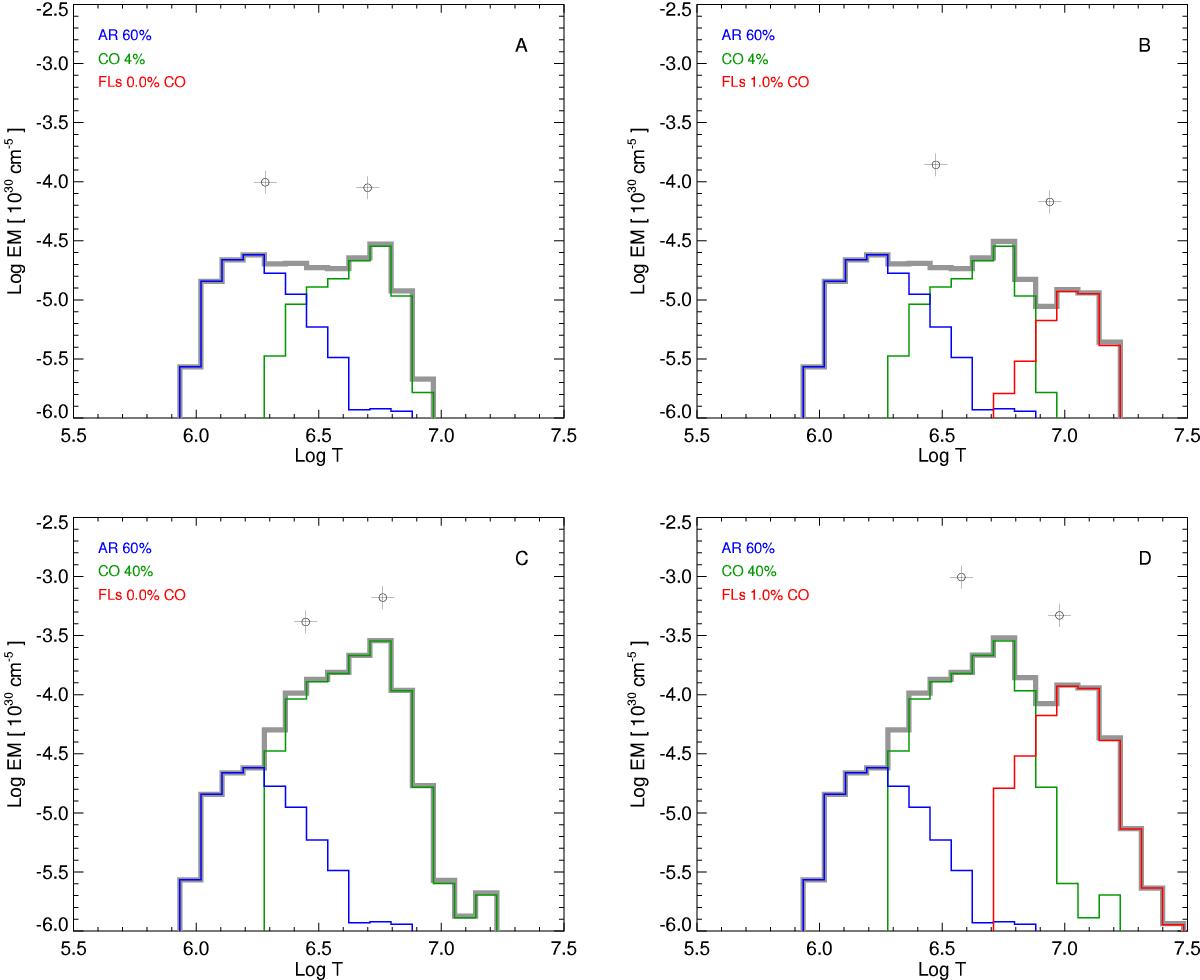
Fig. 2
Simulated distributions of emission measure vs. temperature, EM(T), derived for the minimum (upper panels) and maximum (lower panels) coverage of cores and for the minimum (on the left) and maximum (on the right) coverage of flares. The contributions to EM(T) of active regions (AR, blue), cores (CO, green), and flares (FLs, red) are shown. We assume a constant surface filling factor of active regions (FAR ≈ 60%), a filling factor of cores ranging between 4 (upper panels) and 40% (lower panels), a filling factor of flares ranging between 0 (right panels) and 1% (left panels) of the coverage of cores. The crosses indicate the values of temperature and emission measure of the two isothermal components fitting the corresponding spectra.
Current usage metrics show cumulative count of Article Views (full-text article views including HTML views, PDF and ePub downloads, according to the available data) and Abstracts Views on Vision4Press platform.
Data correspond to usage on the plateform after 2015. The current usage metrics is available 48-96 hours after online publication and is updated daily on week days.
Initial download of the metrics may take a while.