Fig. 1
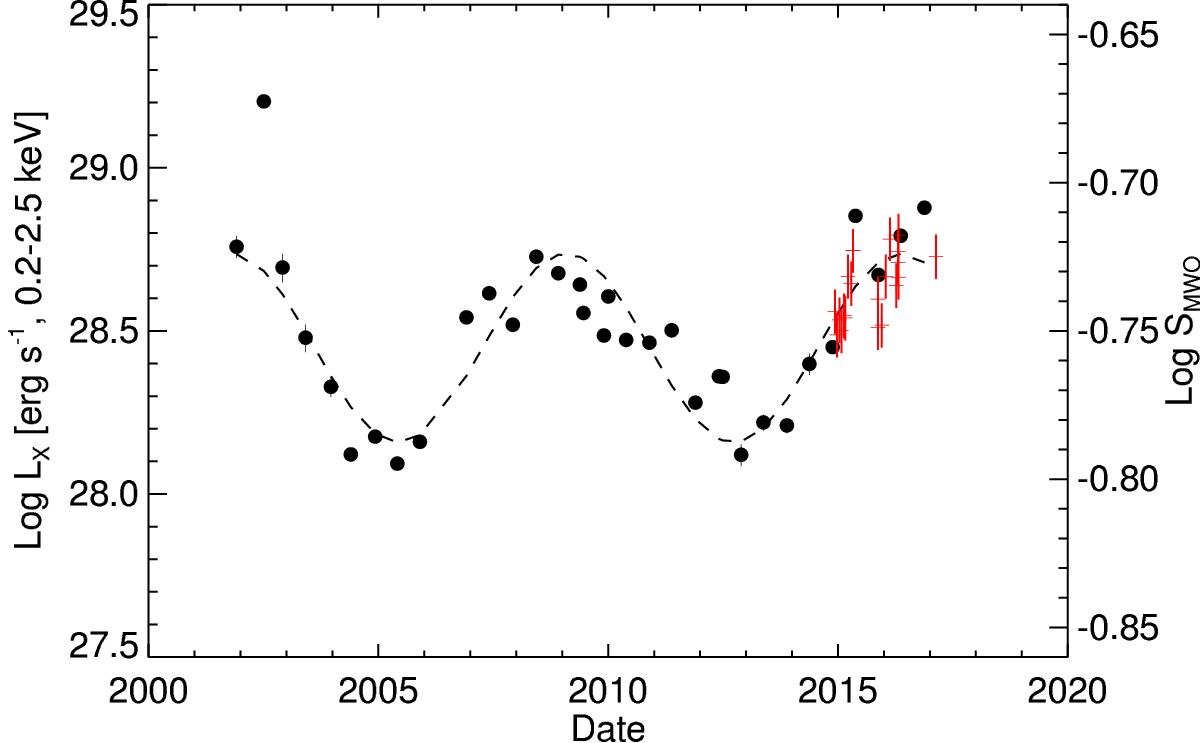
Evolution of the X-ray luminosity in the [ 0.2 − 2.5 ] keV band of HD 81809 from November 2001 to October 2016, covering almost two cycles of coronal activity. The value SMWO for the chromospheric Ca ii activity is superimposed (red crosses, right-hand scale), derived from data collected with the TIGRE telescope. In most of the X-ray data points the uncertainty on the X-ray luminosity is smaller than the symbol size; the uncertainty on the S-index is shown. The dashed curve is a log-sinusoidal function (with a period of 7.3 yr); which fits the X-ray data (see the text).
Current usage metrics show cumulative count of Article Views (full-text article views including HTML views, PDF and ePub downloads, according to the available data) and Abstracts Views on Vision4Press platform.
Data correspond to usage on the plateform after 2015. The current usage metrics is available 48-96 hours after online publication and is updated daily on week days.
Initial download of the metrics may take a while.