Fig. A.2
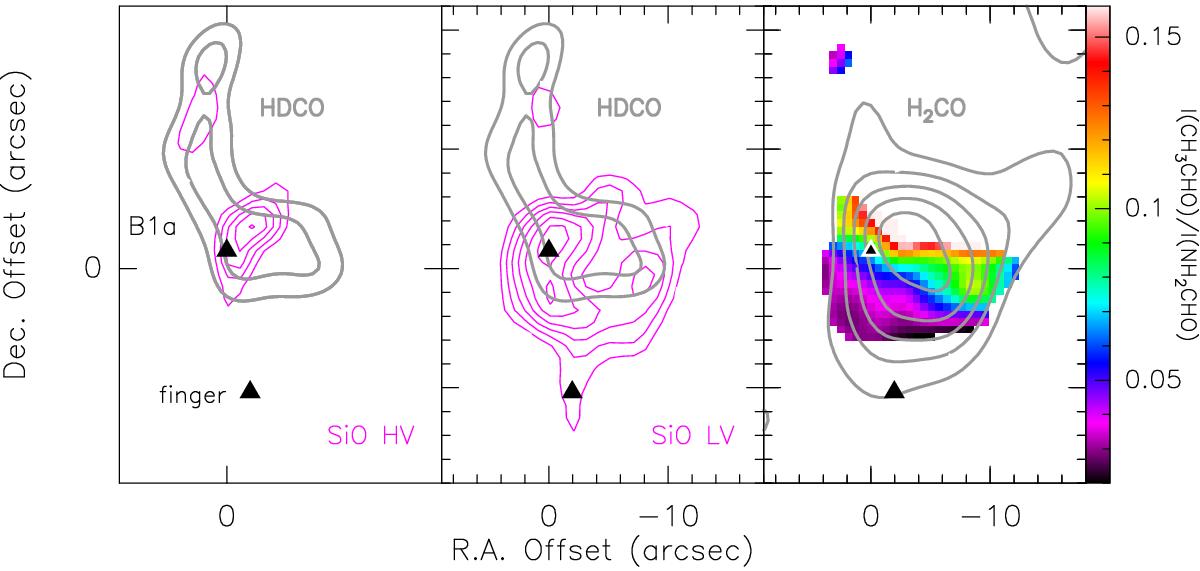
Different shocks in L1157-B1, as traced by HDCO and SiO high- and low-velocity emission. The maps are centred as in Fig. 2. The beams of all the images are reported in Figs. 1 and 2. Left panel: HDCO (21,1–10,1) integrated emission (grey contours; smoothed to the same beam of the NH2CHO map; Fontani et al. 2014) tracing the dust mantle release due to the youngest (within B1) impact (the B1a position; northern black triangle) of the jet against the cavity wall (Gueth et al. 1998; Busquet et al. 2014). The magenta contours represent the high-velocity (HV; from –10 km s-1 up to –18 km s-1 with respect to vsys) SiO (2–1) emission, tracing a smaller region associated with the release of SiO from the dust refractory core. For the HDCO image, the first contour and step are 3σ (1σ = 1 mJy beam-1 km s-1) and 1σ, respectively. For SiO at HV, the first contour and step are 5σ (1σ = 27 mJy beam-1 km s-1) and 10σ, respectively. Middle panel: Same as in the left panel for HDCO. The magenta contours represent the low-velocity (LV; up to –10 km s-1 with respect to vsys) SiO (2–1) emission, tracing a large structure extending towards the south (up to 16″, 4000 AU, from B1a), which creates the so-called “finger” feature (southern black triangle; Gueth et al. 1998) that coincides with the location of the oldest shock within B1. For SiO at LV, the first contour and step are 5σ (1σ = 50 mJy beam-1 km s-1) and 10σ, respectively. Right panel: p-H2CO (20,2–10,1) integrated emission (grey; also smoothed to the same beam of the NH2CHO image; Benedettini et al. 2013). The first contour and step are 3σ (1σ = 3.3 mJy beam-1 km s-1) and 6σ, respectively. In colour is reported the CH3CHO (70,7–60,6 E+A)/NH2CHO (41,4–31,3) line intensity ratio (derived where both emission is at least 3σ) smoothly decreasing from north to south (see the wedge).
Current usage metrics show cumulative count of Article Views (full-text article views including HTML views, PDF and ePub downloads, according to the available data) and Abstracts Views on Vision4Press platform.
Data correspond to usage on the plateform after 2015. The current usage metrics is available 48-96 hours after online publication and is updated daily on week days.
Initial download of the metrics may take a while.