Fig. A.1
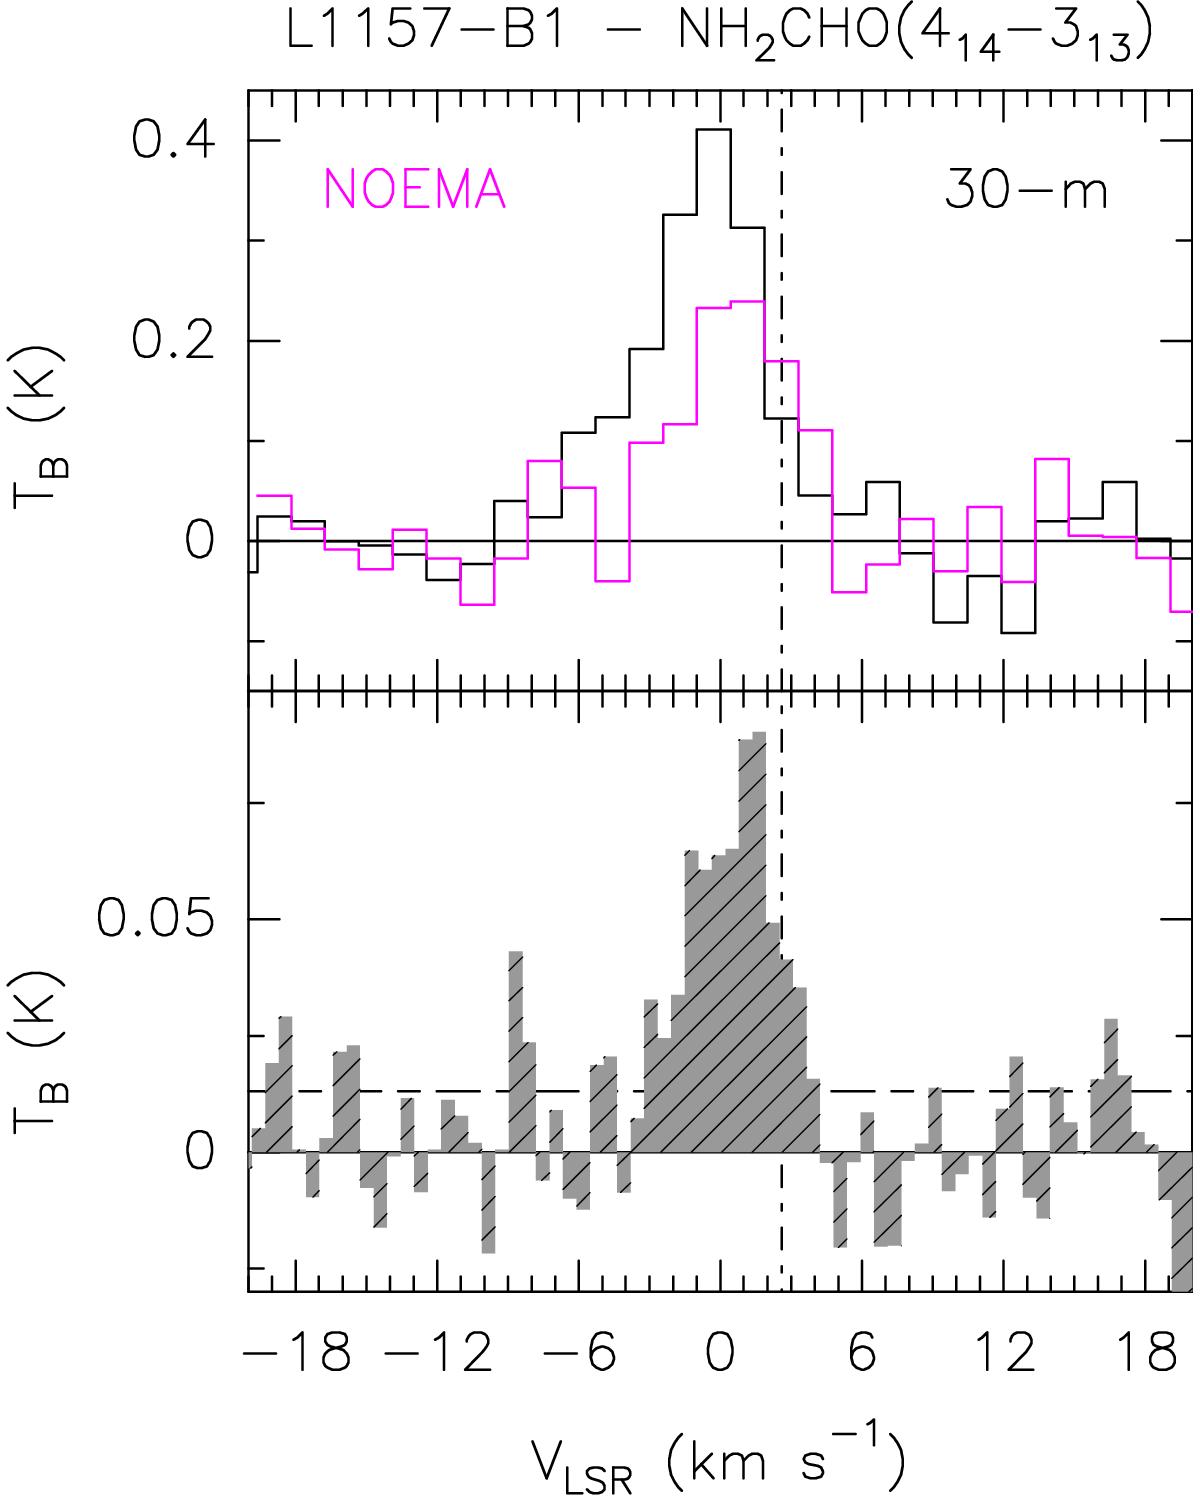
Upper panel: comparison in TB scale of the NH2CHO (41,4–31,3) spectrum as observed using the IRAM 30 m antenna (Mendoza et al. 2014) and that extracted from the present NOEMA map from a circular region equal to the IRAM 30 m HPBW (30″). Fν(Jy) = 4.9493 TB(K). The NOEMA spectrum has been smoothed to match the IRAM 30 m velocity resolution. Lower panel: emission (in TB scale) extracted at the peak of the formamide spatial distribution (see Fig. 2). Horizontal dashed line indicates the 1σ noise level (13 mK).
Current usage metrics show cumulative count of Article Views (full-text article views including HTML views, PDF and ePub downloads, according to the available data) and Abstracts Views on Vision4Press platform.
Data correspond to usage on the plateform after 2015. The current usage metrics is available 48-96 hours after online publication and is updated daily on week days.
Initial download of the metrics may take a while.