Fig. 3
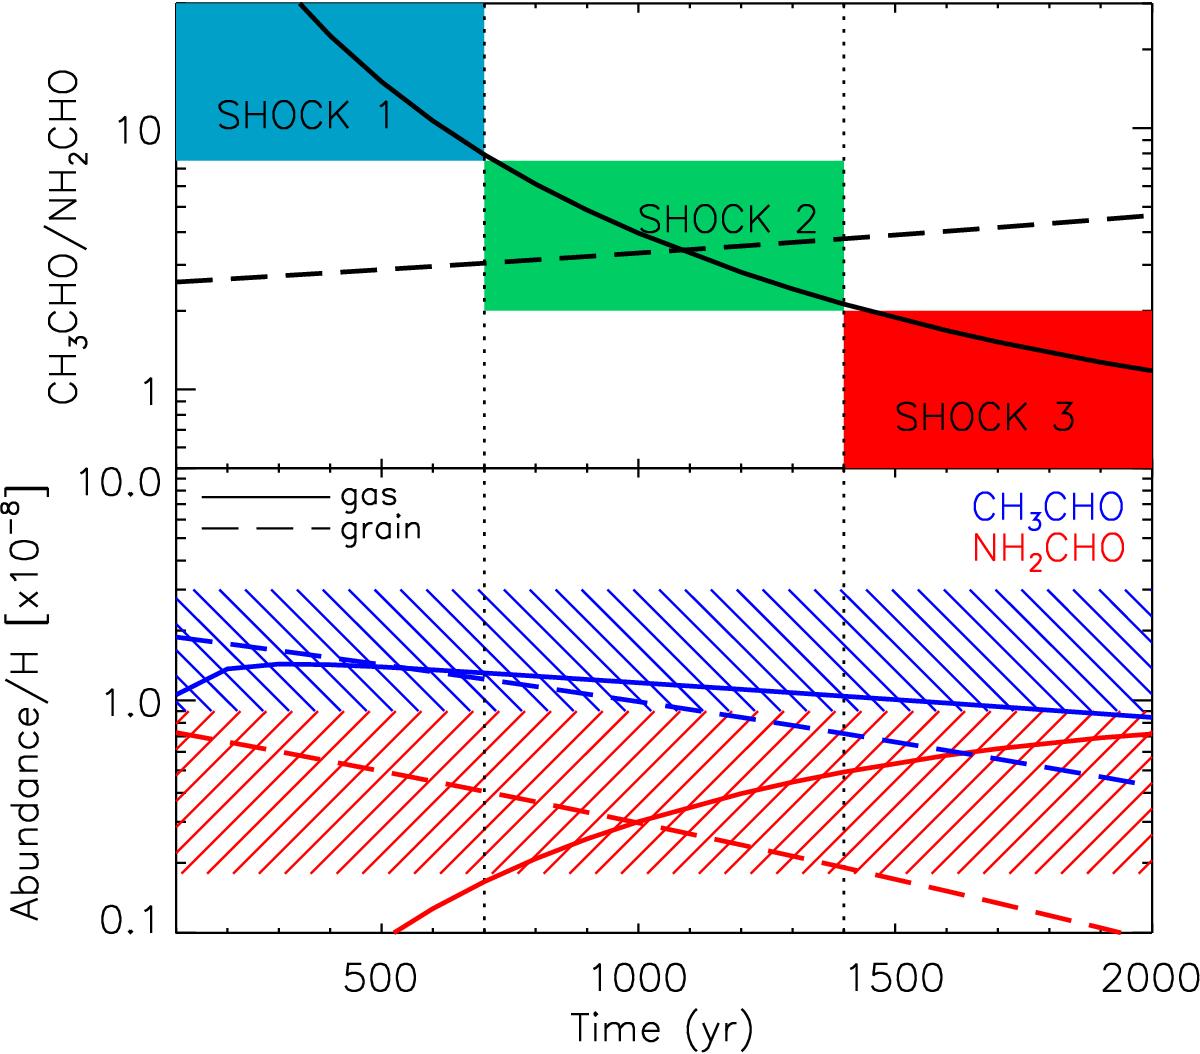
Model predictions of acetaldehyde and formamide after a shock passage. Upper panel: CH3CHO/NH2CHO calculated abundance ratio as a function of time from the passage of the shock. Solid lines refer to a model in which acetaldehyde and formamide are both synthesised in the gas phase, whereas dashed lines refer to predictions assuming that they are injected into the gas phase directly from the grain mantles. The vertical ranges of the three coloured boxes represent the measured ranges, including the uncertainties of the CH3CHO/NH2CHO abundance ratio towards the three zones identified in Fig. 2: SHOCK 1 (ratio >8), SHOCK 2 (ratio 2–8), and SHOCK 3 (ratio ≤2). When not detected, we derived the upper limits on CH3CHO and NH2CHO with the 3σ value. The two dotted vertical lines define the time when the formamide and acetaldehyde abundance ratios (as derived by the gas-phase model) fall below the minimum measured values. Lower panel: acetaldehyde (CH3CHO, blue) and formamide (NH2CHO, red) abundances, with respect to H-nuclei, as a function of time from the passage of the shock. The dashed blue and red regions show the maximum and minimum CH3CHO and NH2CHO measured abundances.
Current usage metrics show cumulative count of Article Views (full-text article views including HTML views, PDF and ePub downloads, according to the available data) and Abstracts Views on Vision4Press platform.
Data correspond to usage on the plateform after 2015. The current usage metrics is available 48-96 hours after online publication and is updated daily on week days.
Initial download of the metrics may take a while.